Aleut vs Immigrants from Saudi Arabia 4 or more Vehicles in Household
COMPARE
Aleut
Immigrants from Saudi Arabia
4 or more Vehicles in Household
4 or more Vehicles in Household Comparison
Aleuts
Immigrants from Saudi Arabia
6.9%
4 OR MORE VEHICLES IN HOUSEHOLD
97.0/ 100
METRIC RATING
111th/ 347
METRIC RANK
5.6%
4 OR MORE VEHICLES IN HOUSEHOLD
1.1/ 100
METRIC RATING
263rd/ 347
METRIC RANK
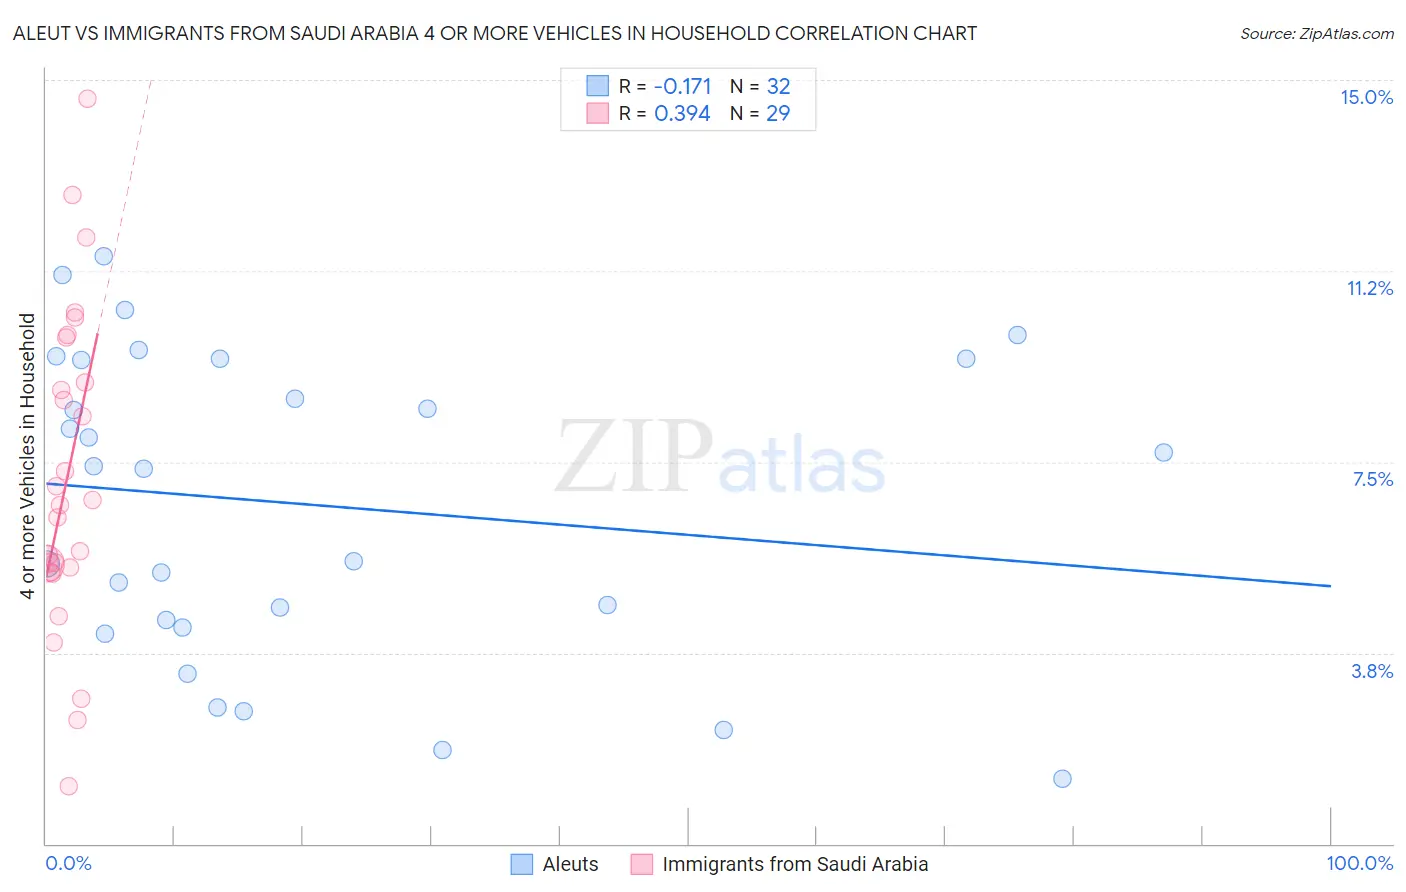
Aleut vs Immigrants from Saudi Arabia 4 or more Vehicles in Household Correlation Chart
The statistical analysis conducted on geographies consisting of 61,735,509 people shows a poor negative correlation between the proportion of Aleuts and percentage of households with 4 or more vehicles available in the United States with a correlation coefficient (R) of -0.171 and weighted average of 6.9%. Similarly, the statistical analysis conducted on geographies consisting of 163,697,717 people shows a mild positive correlation between the proportion of Immigrants from Saudi Arabia and percentage of households with 4 or more vehicles available in the United States with a correlation coefficient (R) of 0.394 and weighted average of 5.6%, a difference of 22.6%.
4 or more Vehicles in Household Correlation Summary
| Measurement | Aleut | Immigrants from Saudi Arabia |
| Minimum | 1.3% | 1.1% |
| Maximum | 11.5% | 14.6% |
| Range | 10.3% | 13.5% |
| Mean | 6.7% | 7.2% |
| Median | 7.4% | 6.6% |
| Interquartile 25% (IQ1) | 4.3% | 5.4% |
| Interquartile 75% (IQ3) | 9.5% | 9.5% |
| Interquartile Range (IQR) | 5.2% | 4.1% |
| Standard Deviation (Sample) | 3.0% | 3.1% |
| Standard Deviation (Population) | 2.9% | 3.1% |
Similar Demographics by 4 or more Vehicles in Household
Demographics Similar to Aleuts by 4 or more Vehicles in Household
In terms of 4 or more vehicles in household, the demographic groups most similar to Aleuts are Hopi (6.9%, a difference of 0.010%), Immigrants from Thailand (6.9%, a difference of 0.020%), Canadian (6.9%, a difference of 0.43%), Bolivian (6.8%, a difference of 0.48%), and Filipino (6.9%, a difference of 0.53%).
| Demographics | Rating | Rank | 4 or more Vehicles in Household |
| Hmong | 98.3 /100 | #104 | Exceptional 7.0% |
| German Russians | 98.3 /100 | #105 | Exceptional 7.0% |
| Guatemalans | 98.1 /100 | #106 | Exceptional 7.0% |
| Nicaraguans | 98.0 /100 | #107 | Exceptional 7.0% |
| French | 97.7 /100 | #108 | Exceptional 6.9% |
| Filipinos | 97.6 /100 | #109 | Exceptional 6.9% |
| Immigrants | Thailand | 97.0 /100 | #110 | Exceptional 6.9% |
| Aleuts | 97.0 /100 | #111 | Exceptional 6.9% |
| Hopi | 97.0 /100 | #112 | Exceptional 6.9% |
| Canadians | 96.4 /100 | #113 | Exceptional 6.9% |
| Bolivians | 96.3 /100 | #114 | Exceptional 6.8% |
| Tlingit-Haida | 96.2 /100 | #115 | Exceptional 6.8% |
| Immigrants | Guatemala | 95.8 /100 | #116 | Exceptional 6.8% |
| Burmese | 95.7 /100 | #117 | Exceptional 6.8% |
| French American Indians | 95.7 /100 | #118 | Exceptional 6.8% |
Demographics Similar to Immigrants from Saudi Arabia by 4 or more Vehicles in Household
In terms of 4 or more vehicles in household, the demographic groups most similar to Immigrants from Saudi Arabia are Bermudan (5.6%, a difference of 0.090%), Sudanese (5.6%, a difference of 0.20%), Uruguayan (5.6%, a difference of 0.29%), Immigrants from France (5.6%, a difference of 0.47%), and Immigrants from Lithuania (5.6%, a difference of 0.51%).
| Demographics | Rating | Rank | 4 or more Vehicles in Household |
| Immigrants | Turkey | 1.5 /100 | #256 | Tragic 5.7% |
| Immigrants | Northern Africa | 1.4 /100 | #257 | Tragic 5.6% |
| Immigrants | Lithuania | 1.4 /100 | #258 | Tragic 5.6% |
| Immigrants | France | 1.3 /100 | #259 | Tragic 5.6% |
| Uruguayans | 1.3 /100 | #260 | Tragic 5.6% |
| Sudanese | 1.2 /100 | #261 | Tragic 5.6% |
| Bermudans | 1.2 /100 | #262 | Tragic 5.6% |
| Immigrants | Saudi Arabia | 1.1 /100 | #263 | Tragic 5.6% |
| Immigrants | Africa | 1.0 /100 | #264 | Tragic 5.6% |
| South Americans | 0.9 /100 | #265 | Tragic 5.6% |
| Immigrants | Nepal | 0.9 /100 | #266 | Tragic 5.6% |
| Immigrants | Ukraine | 0.9 /100 | #267 | Tragic 5.6% |
| Colombians | 0.7 /100 | #268 | Tragic 5.5% |
| Carpatho Rusyns | 0.7 /100 | #269 | Tragic 5.5% |
| Okinawans | 0.6 /100 | #270 | Tragic 5.5% |