Aleut vs Assyrian/Chaldean/Syriac 4 or more Vehicles in Household
COMPARE
Aleut
Assyrian/Chaldean/Syriac
4 or more Vehicles in Household
4 or more Vehicles in Household Comparison
Aleuts
Assyrians/Chaldeans/Syriacs
6.9%
4 OR MORE VEHICLES IN HOUSEHOLD
97.0/ 100
METRIC RATING
111th/ 347
METRIC RANK
7.2%
4 OR MORE VEHICLES IN HOUSEHOLD
99.4/ 100
METRIC RATING
91st/ 347
METRIC RANK
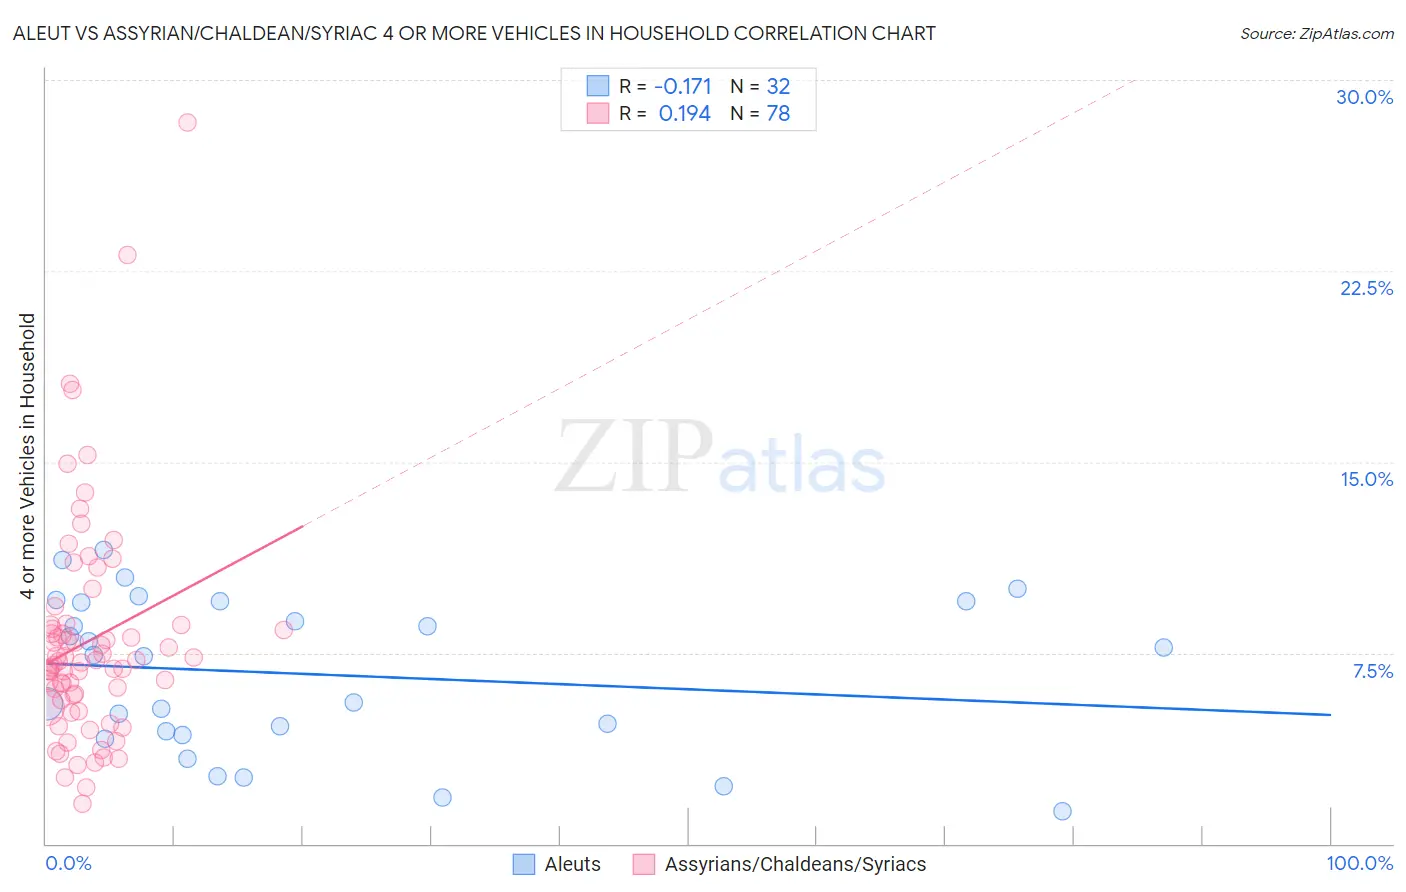
Aleut vs Assyrian/Chaldean/Syriac 4 or more Vehicles in Household Correlation Chart
The statistical analysis conducted on geographies consisting of 61,735,509 people shows a poor negative correlation between the proportion of Aleuts and percentage of households with 4 or more vehicles available in the United States with a correlation coefficient (R) of -0.171 and weighted average of 6.9%. Similarly, the statistical analysis conducted on geographies consisting of 110,163,446 people shows a poor positive correlation between the proportion of Assyrians/Chaldeans/Syriacs and percentage of households with 4 or more vehicles available in the United States with a correlation coefficient (R) of 0.194 and weighted average of 7.2%, a difference of 4.0%.
4 or more Vehicles in Household Correlation Summary
| Measurement | Aleut | Assyrian/Chaldean/Syriac |
| Minimum | 1.3% | 1.6% |
| Maximum | 11.5% | 28.3% |
| Range | 10.3% | 26.7% |
| Mean | 6.7% | 8.0% |
| Median | 7.4% | 7.1% |
| Interquartile 25% (IQ1) | 4.3% | 5.6% |
| Interquartile 75% (IQ3) | 9.5% | 8.6% |
| Interquartile Range (IQR) | 5.2% | 2.9% |
| Standard Deviation (Sample) | 3.0% | 4.4% |
| Standard Deviation (Population) | 2.9% | 4.4% |
Demographics Similar to Aleuts and Assyrians/Chaldeans/Syriacs by 4 or more Vehicles in Household
In terms of 4 or more vehicles in household, the demographic groups most similar to Aleuts are Immigrants from Thailand (6.9%, a difference of 0.020%), Filipino (6.9%, a difference of 0.53%), French (6.9%, a difference of 0.71%), Nicaraguan (7.0%, a difference of 1.1%), and Guatemalan (7.0%, a difference of 1.1%). Similarly, the demographic groups most similar to Assyrians/Chaldeans/Syriacs are Immigrants from Latin America (7.1%, a difference of 0.16%), Immigrants from Afghanistan (7.1%, a difference of 0.33%), Dutch West Indian (7.1%, a difference of 0.34%), Czechoslovakian (7.1%, a difference of 0.55%), and Central American (7.1%, a difference of 0.56%).
| Demographics | Rating | Rank | 4 or more Vehicles in Household |
| Assyrians/Chaldeans/Syriacs | 99.4 /100 | #91 | Exceptional 7.2% |
| Immigrants | Latin America | 99.4 /100 | #92 | Exceptional 7.1% |
| Immigrants | Afghanistan | 99.3 /100 | #93 | Exceptional 7.1% |
| Dutch West Indians | 99.3 /100 | #94 | Exceptional 7.1% |
| Czechoslovakians | 99.3 /100 | #95 | Exceptional 7.1% |
| Central Americans | 99.3 /100 | #96 | Exceptional 7.1% |
| Celtics | 99.1 /100 | #97 | Exceptional 7.1% |
| Irish | 99.0 /100 | #98 | Exceptional 7.1% |
| Seminole | 98.8 /100 | #99 | Exceptional 7.0% |
| Taiwanese | 98.7 /100 | #100 | Exceptional 7.0% |
| Pakistanis | 98.7 /100 | #101 | Exceptional 7.0% |
| Asians | 98.6 /100 | #102 | Exceptional 7.0% |
| Blackfeet | 98.6 /100 | #103 | Exceptional 7.0% |
| Hmong | 98.3 /100 | #104 | Exceptional 7.0% |
| German Russians | 98.3 /100 | #105 | Exceptional 7.0% |
| Guatemalans | 98.1 /100 | #106 | Exceptional 7.0% |
| Nicaraguans | 98.0 /100 | #107 | Exceptional 7.0% |
| French | 97.7 /100 | #108 | Exceptional 6.9% |
| Filipinos | 97.6 /100 | #109 | Exceptional 6.9% |
| Immigrants | Thailand | 97.0 /100 | #110 | Exceptional 6.9% |
| Aleuts | 97.0 /100 | #111 | Exceptional 6.9% |