Aleut vs Danish 4 or more Vehicles in Household
COMPARE
Aleut
Danish
4 or more Vehicles in Household
4 or more Vehicles in Household Comparison
Aleuts
Danes
6.9%
4 OR MORE VEHICLES IN HOUSEHOLD
97.0/ 100
METRIC RATING
111th/ 347
METRIC RANK
8.6%
4 OR MORE VEHICLES IN HOUSEHOLD
100.0/ 100
METRIC RATING
21st/ 347
METRIC RANK
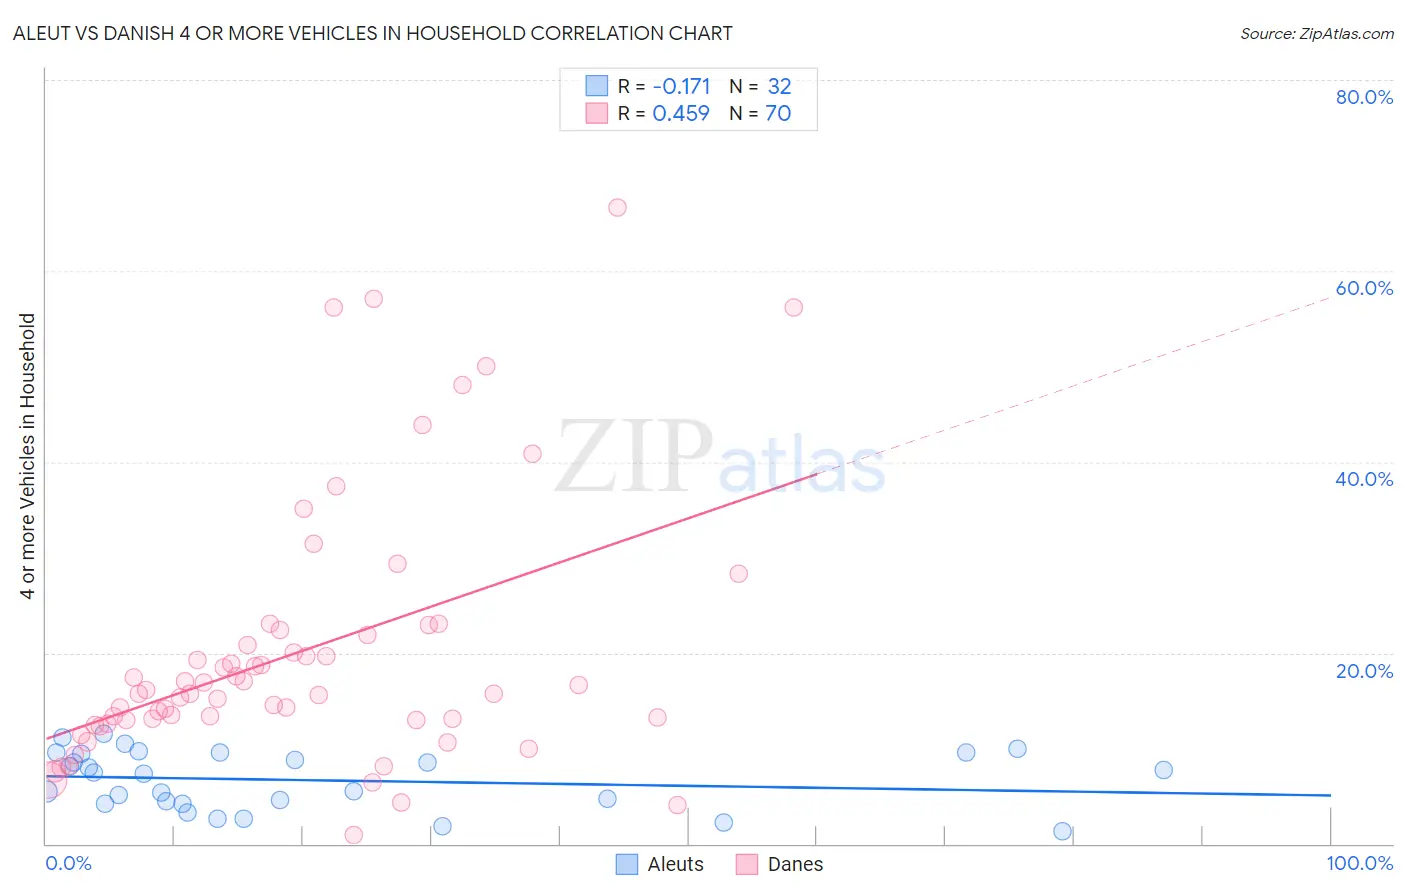
Aleut vs Danish 4 or more Vehicles in Household Correlation Chart
The statistical analysis conducted on geographies consisting of 61,735,509 people shows a poor negative correlation between the proportion of Aleuts and percentage of households with 4 or more vehicles available in the United States with a correlation coefficient (R) of -0.171 and weighted average of 6.9%. Similarly, the statistical analysis conducted on geographies consisting of 472,183,254 people shows a moderate positive correlation between the proportion of Danes and percentage of households with 4 or more vehicles available in the United States with a correlation coefficient (R) of 0.459 and weighted average of 8.6%, a difference of 24.6%.
4 or more Vehicles in Household Correlation Summary
| Measurement | Aleut | Danish |
| Minimum | 1.3% | 0.95% |
| Maximum | 11.5% | 66.7% |
| Range | 10.3% | 65.7% |
| Mean | 6.7% | 20.0% |
| Median | 7.4% | 15.7% |
| Interquartile 25% (IQ1) | 4.3% | 12.9% |
| Interquartile 75% (IQ3) | 9.5% | 21.9% |
| Interquartile Range (IQR) | 5.2% | 9.0% |
| Standard Deviation (Sample) | 3.0% | 13.7% |
| Standard Deviation (Population) | 2.9% | 13.6% |
Similar Demographics by 4 or more Vehicles in Household
Demographics Similar to Aleuts by 4 or more Vehicles in Household
In terms of 4 or more vehicles in household, the demographic groups most similar to Aleuts are Hopi (6.9%, a difference of 0.010%), Immigrants from Thailand (6.9%, a difference of 0.020%), Canadian (6.9%, a difference of 0.43%), Bolivian (6.8%, a difference of 0.48%), and Filipino (6.9%, a difference of 0.53%).
| Demographics | Rating | Rank | 4 or more Vehicles in Household |
| Hmong | 98.3 /100 | #104 | Exceptional 7.0% |
| German Russians | 98.3 /100 | #105 | Exceptional 7.0% |
| Guatemalans | 98.1 /100 | #106 | Exceptional 7.0% |
| Nicaraguans | 98.0 /100 | #107 | Exceptional 7.0% |
| French | 97.7 /100 | #108 | Exceptional 6.9% |
| Filipinos | 97.6 /100 | #109 | Exceptional 6.9% |
| Immigrants | Thailand | 97.0 /100 | #110 | Exceptional 6.9% |
| Aleuts | 97.0 /100 | #111 | Exceptional 6.9% |
| Hopi | 97.0 /100 | #112 | Exceptional 6.9% |
| Canadians | 96.4 /100 | #113 | Exceptional 6.9% |
| Bolivians | 96.3 /100 | #114 | Exceptional 6.8% |
| Tlingit-Haida | 96.2 /100 | #115 | Exceptional 6.8% |
| Immigrants | Guatemala | 95.8 /100 | #116 | Exceptional 6.8% |
| Burmese | 95.7 /100 | #117 | Exceptional 6.8% |
| French American Indians | 95.7 /100 | #118 | Exceptional 6.8% |
Demographics Similar to Danes by 4 or more Vehicles in Household
In terms of 4 or more vehicles in household, the demographic groups most similar to Danes are Pueblo (8.6%, a difference of 0.050%), Immigrants from Vietnam (8.6%, a difference of 0.050%), Immigrants from Philippines (8.5%, a difference of 0.26%), Korean (8.6%, a difference of 0.87%), and Immigrants from Central America (8.5%, a difference of 1.1%).
| Demographics | Rating | Rank | 4 or more Vehicles in Household |
| Chinese | 100.0 /100 | #14 | Exceptional 8.8% |
| Shoshone | 100.0 /100 | #15 | Exceptional 8.8% |
| Lumbee | 100.0 /100 | #16 | Exceptional 8.8% |
| Ute | 100.0 /100 | #17 | Exceptional 8.8% |
| Nepalese | 100.0 /100 | #18 | Exceptional 8.7% |
| Koreans | 100.0 /100 | #19 | Exceptional 8.6% |
| Pueblo | 100.0 /100 | #20 | Exceptional 8.6% |
| Danes | 100.0 /100 | #21 | Exceptional 8.6% |
| Immigrants | Vietnam | 100.0 /100 | #22 | Exceptional 8.6% |
| Immigrants | Philippines | 100.0 /100 | #23 | Exceptional 8.5% |
| Immigrants | Central America | 100.0 /100 | #24 | Exceptional 8.5% |
| Basques | 100.0 /100 | #25 | Exceptional 8.4% |
| Mexican American Indians | 100.0 /100 | #26 | Exceptional 8.4% |
| Sri Lankans | 100.0 /100 | #27 | Exceptional 8.4% |
| Cheyenne | 100.0 /100 | #28 | Exceptional 8.3% |