Alaska Native vs Immigrants from Cabo Verde 2 or more Vehicles in Household
COMPARE
Alaska Native
Immigrants from Cabo Verde
2 or more Vehicles in Household
2 or more Vehicles in Household Comparison
Alaska Natives
Immigrants from Cabo Verde
53.6%
2 OR MORE VEHICLES IN HOUSEHOLD
3.9/ 100
METRIC RATING
228th/ 347
METRIC RANK
43.3%
2 OR MORE VEHICLES IN HOUSEHOLD
0.0/ 100
METRIC RATING
324th/ 347
METRIC RANK
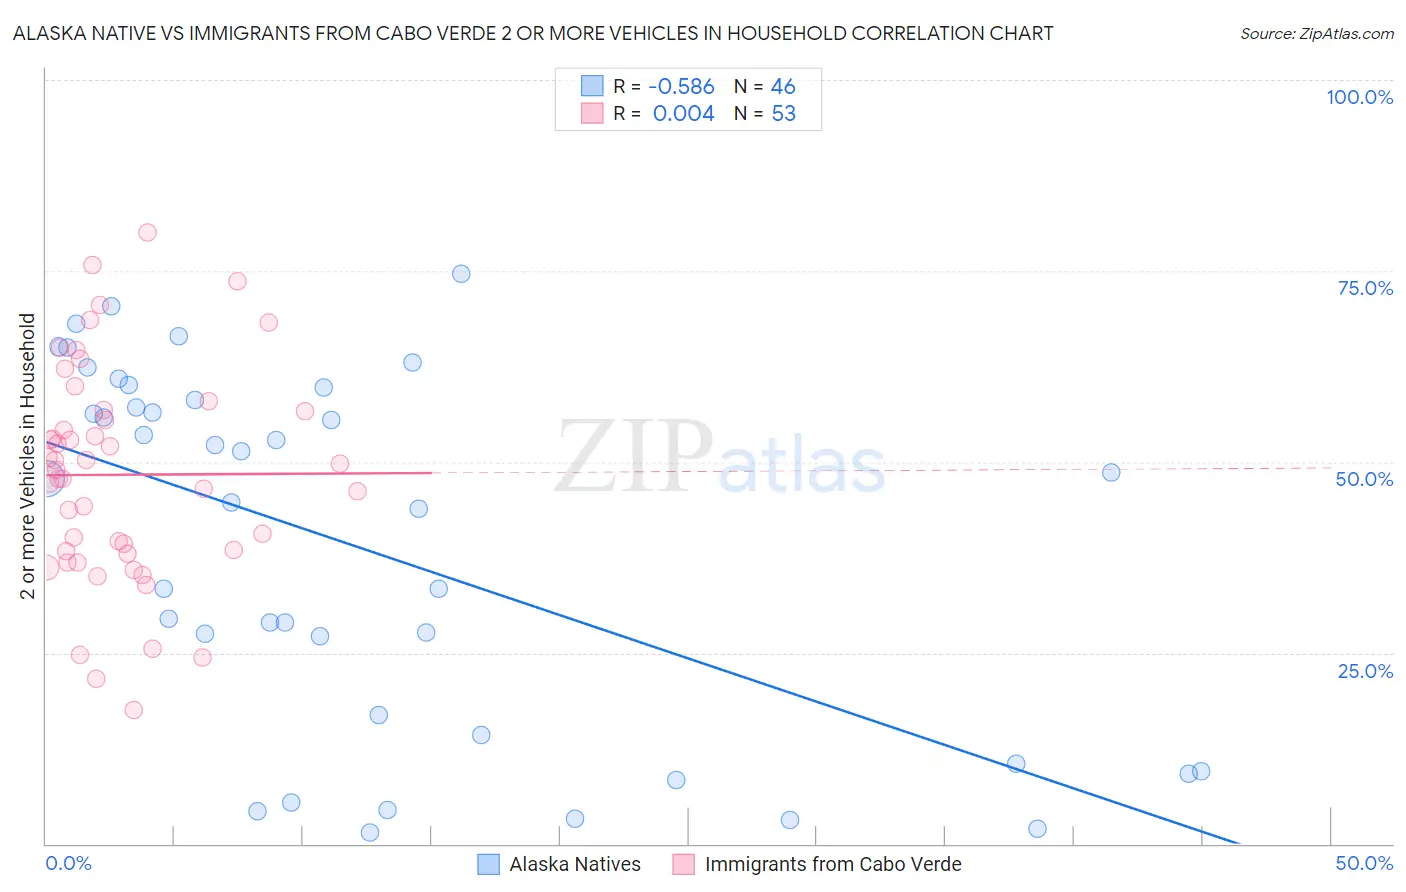
Alaska Native vs Immigrants from Cabo Verde 2 or more Vehicles in Household Correlation Chart
The statistical analysis conducted on geographies consisting of 76,736,682 people shows a substantial negative correlation between the proportion of Alaska Natives and percentage of households with 2 or more vehicles available in the United States with a correlation coefficient (R) of -0.586 and weighted average of 53.6%. Similarly, the statistical analysis conducted on geographies consisting of 38,145,332 people shows no correlation between the proportion of Immigrants from Cabo Verde and percentage of households with 2 or more vehicles available in the United States with a correlation coefficient (R) of 0.004 and weighted average of 43.3%, a difference of 23.7%.
2 or more Vehicles in Household Correlation Summary
| Measurement | Alaska Native | Immigrants from Cabo Verde |
| Minimum | 1.5% | 17.5% |
| Maximum | 74.6% | 80.1% |
| Range | 73.1% | 62.6% |
| Mean | 38.7% | 48.3% |
| Median | 46.2% | 48.9% |
| Interquartile 25% (IQ1) | 14.3% | 38.1% |
| Interquartile 75% (IQ3) | 58.0% | 56.7% |
| Interquartile Range (IQR) | 43.8% | 18.6% |
| Standard Deviation (Sample) | 23.4% | 14.1% |
| Standard Deviation (Population) | 23.2% | 14.0% |
Similar Demographics by 2 or more Vehicles in Household
Demographics Similar to Alaska Natives by 2 or more Vehicles in Household
In terms of 2 or more vehicles in household, the demographic groups most similar to Alaska Natives are Immigrants from Turkey (53.6%, a difference of 0.020%), Sudanese (53.6%, a difference of 0.060%), Immigrants from Nepal (53.5%, a difference of 0.080%), Panamanian (53.5%, a difference of 0.13%), and Immigrants from Guatemala (53.5%, a difference of 0.20%).
| Demographics | Rating | Rank | 2 or more Vehicles in Household |
| Immigrants | Singapore | 6.3 /100 | #221 | Tragic 53.9% |
| Kiowa | 6.2 /100 | #222 | Tragic 53.9% |
| Immigrants | Bosnia and Herzegovina | 5.5 /100 | #223 | Tragic 53.8% |
| Brazilians | 5.3 /100 | #224 | Tragic 53.8% |
| Immigrants | Egypt | 5.2 /100 | #225 | Tragic 53.8% |
| Immigrants | Eastern Africa | 5.1 /100 | #226 | Tragic 53.7% |
| Sudanese | 4.1 /100 | #227 | Tragic 53.6% |
| Alaska Natives | 3.9 /100 | #228 | Tragic 53.6% |
| Immigrants | Turkey | 3.8 /100 | #229 | Tragic 53.6% |
| Immigrants | Nepal | 3.6 /100 | #230 | Tragic 53.5% |
| Panamanians | 3.4 /100 | #231 | Tragic 53.5% |
| Immigrants | Guatemala | 3.2 /100 | #232 | Tragic 53.5% |
| Ugandans | 3.2 /100 | #233 | Tragic 53.5% |
| Immigrants | Switzerland | 3.0 /100 | #234 | Tragic 53.4% |
| Immigrants | Middle Africa | 3.0 /100 | #235 | Tragic 53.4% |
Demographics Similar to Immigrants from Cabo Verde by 2 or more Vehicles in Household
In terms of 2 or more vehicles in household, the demographic groups most similar to Immigrants from Cabo Verde are Immigrants from West Indies (43.1%, a difference of 0.57%), Immigrants from Senegal (43.0%, a difference of 0.72%), Immigrants from Yemen (42.8%, a difference of 1.1%), Inupiat (42.6%, a difference of 1.6%), and Immigrants from Caribbean (44.2%, a difference of 2.1%).
| Demographics | Rating | Rank | 2 or more Vehicles in Household |
| Immigrants | Haiti | 0.0 /100 | #317 | Tragic 46.5% |
| Immigrants | Albania | 0.0 /100 | #318 | Tragic 46.0% |
| Jamaicans | 0.0 /100 | #319 | Tragic 45.8% |
| Soviet Union | 0.0 /100 | #320 | Tragic 45.7% |
| Immigrants | Jamaica | 0.0 /100 | #321 | Tragic 44.5% |
| Senegalese | 0.0 /100 | #322 | Tragic 44.2% |
| Immigrants | Caribbean | 0.0 /100 | #323 | Tragic 44.2% |
| Immigrants | Cabo Verde | 0.0 /100 | #324 | Tragic 43.3% |
| Immigrants | West Indies | 0.0 /100 | #325 | Tragic 43.1% |
| Immigrants | Senegal | 0.0 /100 | #326 | Tragic 43.0% |
| Immigrants | Yemen | 0.0 /100 | #327 | Tragic 42.8% |
| Inupiat | 0.0 /100 | #328 | Tragic 42.6% |
| Ecuadorians | 0.0 /100 | #329 | Tragic 42.0% |
| Immigrants | Dominica | 0.0 /100 | #330 | Tragic 41.6% |
| West Indians | 0.0 /100 | #331 | Tragic 41.3% |