Alaska Native vs Immigrants from Ghana 2 or more Vehicles in Household
COMPARE
Alaska Native
Immigrants from Ghana
2 or more Vehicles in Household
2 or more Vehicles in Household Comparison
Alaska Natives
Immigrants from Ghana
53.6%
2 OR MORE VEHICLES IN HOUSEHOLD
3.9/ 100
METRIC RATING
228th/ 347
METRIC RANK
47.4%
2 OR MORE VEHICLES IN HOUSEHOLD
0.0/ 100
METRIC RATING
314th/ 347
METRIC RANK
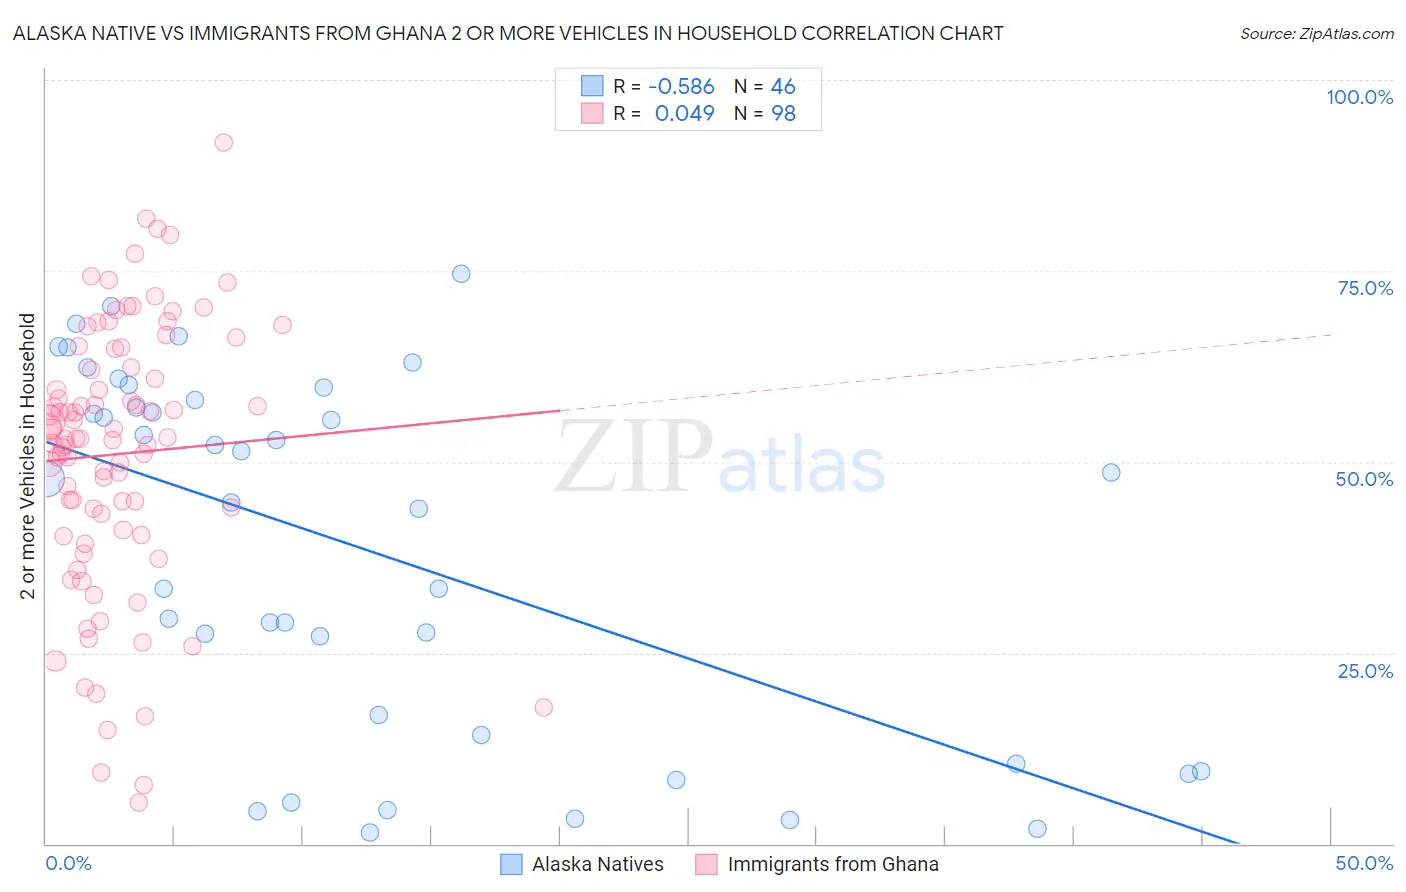
Alaska Native vs Immigrants from Ghana 2 or more Vehicles in Household Correlation Chart
The statistical analysis conducted on geographies consisting of 76,736,682 people shows a substantial negative correlation between the proportion of Alaska Natives and percentage of households with 2 or more vehicles available in the United States with a correlation coefficient (R) of -0.586 and weighted average of 53.6%. Similarly, the statistical analysis conducted on geographies consisting of 199,813,535 people shows no correlation between the proportion of Immigrants from Ghana and percentage of households with 2 or more vehicles available in the United States with a correlation coefficient (R) of 0.049 and weighted average of 47.4%, a difference of 13.1%.
2 or more Vehicles in Household Correlation Summary
| Measurement | Alaska Native | Immigrants from Ghana |
| Minimum | 1.5% | 5.4% |
| Maximum | 74.6% | 91.9% |
| Range | 73.1% | 86.4% |
| Mean | 38.7% | 51.0% |
| Median | 46.2% | 53.0% |
| Interquartile 25% (IQ1) | 14.3% | 41.0% |
| Interquartile 75% (IQ3) | 58.0% | 62.3% |
| Interquartile Range (IQR) | 43.8% | 21.3% |
| Standard Deviation (Sample) | 23.4% | 17.5% |
| Standard Deviation (Population) | 23.2% | 17.5% |
Similar Demographics by 2 or more Vehicles in Household
Demographics Similar to Alaska Natives by 2 or more Vehicles in Household
In terms of 2 or more vehicles in household, the demographic groups most similar to Alaska Natives are Immigrants from Turkey (53.6%, a difference of 0.020%), Sudanese (53.6%, a difference of 0.060%), Immigrants from Nepal (53.5%, a difference of 0.080%), Panamanian (53.5%, a difference of 0.13%), and Immigrants from Guatemala (53.5%, a difference of 0.20%).
| Demographics | Rating | Rank | 2 or more Vehicles in Household |
| Immigrants | Singapore | 6.3 /100 | #221 | Tragic 53.9% |
| Kiowa | 6.2 /100 | #222 | Tragic 53.9% |
| Immigrants | Bosnia and Herzegovina | 5.5 /100 | #223 | Tragic 53.8% |
| Brazilians | 5.3 /100 | #224 | Tragic 53.8% |
| Immigrants | Egypt | 5.2 /100 | #225 | Tragic 53.8% |
| Immigrants | Eastern Africa | 5.1 /100 | #226 | Tragic 53.7% |
| Sudanese | 4.1 /100 | #227 | Tragic 53.6% |
| Alaska Natives | 3.9 /100 | #228 | Tragic 53.6% |
| Immigrants | Turkey | 3.8 /100 | #229 | Tragic 53.6% |
| Immigrants | Nepal | 3.6 /100 | #230 | Tragic 53.5% |
| Panamanians | 3.4 /100 | #231 | Tragic 53.5% |
| Immigrants | Guatemala | 3.2 /100 | #232 | Tragic 53.5% |
| Ugandans | 3.2 /100 | #233 | Tragic 53.5% |
| Immigrants | Switzerland | 3.0 /100 | #234 | Tragic 53.4% |
| Immigrants | Middle Africa | 3.0 /100 | #235 | Tragic 53.4% |
Demographics Similar to Immigrants from Ghana by 2 or more Vehicles in Household
In terms of 2 or more vehicles in household, the demographic groups most similar to Immigrants from Ghana are U.S. Virgin Islander (47.5%, a difference of 0.22%), Haitian (47.6%, a difference of 0.40%), Puerto Rican (47.1%, a difference of 0.57%), Immigrants from Belarus (47.9%, a difference of 1.1%), and Ghanaian (48.0%, a difference of 1.3%).
| Demographics | Rating | Rank | 2 or more Vehicles in Household |
| Hopi | 0.0 /100 | #307 | Tragic 49.0% |
| Albanians | 0.0 /100 | #308 | Tragic 49.0% |
| Moroccans | 0.0 /100 | #309 | Tragic 48.8% |
| Ghanaians | 0.0 /100 | #310 | Tragic 48.0% |
| Immigrants | Belarus | 0.0 /100 | #311 | Tragic 47.9% |
| Haitians | 0.0 /100 | #312 | Tragic 47.6% |
| U.S. Virgin Islanders | 0.0 /100 | #313 | Tragic 47.5% |
| Immigrants | Ghana | 0.0 /100 | #314 | Tragic 47.4% |
| Puerto Ricans | 0.0 /100 | #315 | Tragic 47.1% |
| Cape Verdeans | 0.0 /100 | #316 | Tragic 46.8% |
| Immigrants | Haiti | 0.0 /100 | #317 | Tragic 46.5% |
| Immigrants | Albania | 0.0 /100 | #318 | Tragic 46.0% |
| Jamaicans | 0.0 /100 | #319 | Tragic 45.8% |
| Soviet Union | 0.0 /100 | #320 | Tragic 45.7% |
| Immigrants | Jamaica | 0.0 /100 | #321 | Tragic 44.5% |