Zip Codes with the Highest Percentage of Population with a Degree in Business in South Dakota
RELATED REPORTS & OPTIONS
Business
South Dakota
Compare Zip Codes
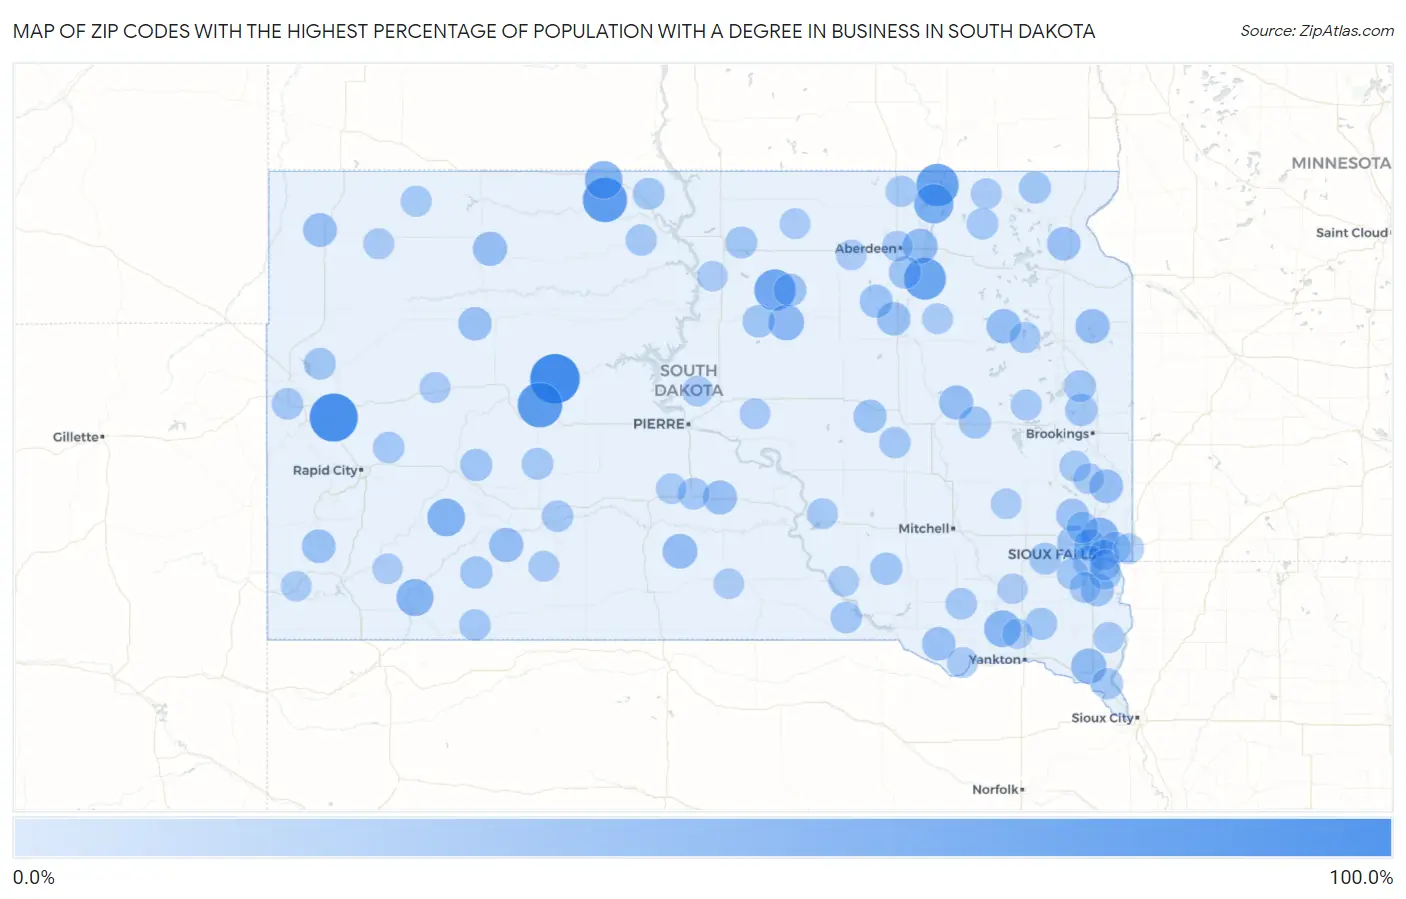
Map of Zip Codes with the Highest Percentage of Population with a Degree in Business in South Dakota
0.0%
100.0%
Zip Codes with the Highest Percentage of Population with a Degree in Business in South Dakota
| Zip Code | % Graduates | vs State | vs National | |
| 1. | 57622 | 100.0% | 17.8%(+82.2)#1 | 19.5%(+80.5)#58 |
| 2. | 57741 | 93.9% | 17.8%(+76.2)#2 | 19.5%(+74.4)#193 |
| 3. | 57553 | 79.4% | 17.8%(+61.6)#3 | 19.5%(+59.9)#233 |
| 4. | 57621 | 77.8% | 17.8%(+60.0)#4 | 19.5%(+58.3)#243 |
| 5. | 57446 | 69.6% | 17.8%(+51.9)#5 | 19.5%(+50.1)#299 |
| 6. | 57474 | 67.6% | 17.8%(+49.8)#6 | 19.5%(+48.1)#315 |
| 7. | 57475 | 65.4% | 17.8%(+47.6)#7 | 19.5%(+45.9)#359 |
| 8. | 57449 | 57.0% | 17.8%(+39.2)#8 | 19.5%(+37.5)#484 |
| 9. | 57780 | 50.0% | 17.8%(+32.2)#9 | 19.5%(+30.5)#710 |
| 10. | 57659 | 50.0% | 17.8%(+32.2)#10 | 19.5%(+30.5)#720 |
| 11. | 57764 | 47.4% | 17.8%(+29.6)#11 | 19.5%(+27.9)#778 |
| 12. | 57055 | 47.4% | 17.8%(+29.6)#12 | 19.5%(+27.9)#781 |
| 13. | 57040 | 46.2% | 17.8%(+28.4)#13 | 19.5%(+26.7)#837 |
| 14. | 57473 | 42.1% | 17.8%(+24.3)#14 | 19.5%(+22.6)#1,064 |
| 15. | 57010 | 39.7% | 17.8%(+21.9)#15 | 19.5%(+20.2)#1,253 |
| 16. | 57427 | 39.4% | 17.8%(+21.7)#16 | 19.5%(+19.9)#1,269 |
| 17. | 57585 | 37.5% | 17.8%(+19.7)#17 | 19.5%(+18.0)#1,435 |
| 18. | 57236 | 36.4% | 17.8%(+18.6)#18 | 19.5%(+16.9)#1,555 |
| 19. | 57644 | 36.1% | 17.8%(+18.3)#19 | 19.5%(+16.6)#1,587 |
| 20. | 57265 | 36.0% | 17.8%(+18.2)#20 | 19.5%(+16.5)#1,605 |
| 21. | 57750 | 35.7% | 17.8%(+17.9)#21 | 19.5%(+16.2)#1,648 |
| 22. | 57386 | 35.2% | 17.8%(+17.4)#22 | 19.5%(+15.7)#1,705 |
| 23. | 57568 | 34.8% | 17.8%(+17.0)#23 | 19.5%(+15.3)#1,765 |
| 24. | 57720 | 34.1% | 17.8%(+16.3)#24 | 19.5%(+14.6)#1,866 |
| 25. | 57024 | 33.7% | 17.8%(+15.9)#25 | 19.5%(+14.2)#1,931 |
| 26. | 57773 | 33.3% | 17.8%(+15.6)#26 | 19.5%(+13.8)#2,013 |
| 27. | 57626 | 32.8% | 17.8%(+15.0)#27 | 19.5%(+13.3)#2,116 |
| 28. | 57257 | 32.7% | 17.8%(+14.9)#28 | 19.5%(+13.2)#2,133 |
| 29. | 57329 | 32.6% | 17.8%(+14.8)#29 | 19.5%(+13.1)#2,149 |
| 30. | 57424 | 32.4% | 17.8%(+14.7)#30 | 19.5%(+12.9)#2,170 |
| 31. | 57381 | 31.7% | 17.8%(+14.0)#31 | 19.5%(+12.2)#2,344 |
| 32. | 57033 | 31.4% | 17.8%(+13.7)#32 | 19.5%(+11.9)#2,407 |
| 33. | 57465 | 30.7% | 17.8%(+12.9)#33 | 19.5%(+11.2)#2,620 |
| 34. | 57077 | 29.7% | 17.8%(+11.9)#34 | 19.5%(+10.2)#2,952 |
| 35. | 57466 | 29.5% | 17.8%(+11.8)#35 | 19.5%(+10.0)#2,995 |
| 36. | 57018 | 29.3% | 17.8%(+11.5)#36 | 19.5%(+9.83)#3,080 |
| 37. | 57455 | 28.6% | 17.8%(+10.8)#37 | 19.5%(+9.07)#3,411 |
| 38. | 57479 | 28.4% | 17.8%(+10.6)#38 | 19.5%(+8.88)#3,484 |
| 39. | 57752 | 28.0% | 17.8%(+10.2)#39 | 19.5%(+8.50)#3,683 |
| 40. | 57790 | 27.8% | 17.8%(+10.0)#40 | 19.5%(+8.33)#3,767 |
| 41. | 57220 | 27.8% | 17.8%(+10.0)#41 | 19.5%(+8.33)#3,771 |
| 42. | 57344 | 27.8% | 17.8%(+10.00)#42 | 19.5%(+8.28)#3,805 |
| 43. | 57353 | 27.7% | 17.8%(+9.96)#43 | 19.5%(+8.24)#3,814 |
| 44. | 57270 | 26.9% | 17.8%(+9.10)#44 | 19.5%(+7.38)#4,261 |
| 45. | 57037 | 26.5% | 17.8%(+8.75)#45 | 19.5%(+7.03)#4,524 |
| 46. | 57234 | 26.2% | 17.8%(+8.38)#46 | 19.5%(+6.66)#4,770 |
| 47. | 57642 | 26.1% | 17.8%(+8.34)#47 | 19.5%(+6.63)#4,794 |
| 48. | 57452 | 26.1% | 17.8%(+8.31)#48 | 19.5%(+6.59)#4,822 |
| 49. | 57047 | 25.8% | 17.8%(+8.02)#49 | 19.5%(+6.31)#5,010 |
| 50. | 57032 | 25.8% | 17.8%(+8.00)#50 | 19.5%(+6.28)#5,026 |
| 51. | 57762 | 25.6% | 17.8%(+7.86)#51 | 19.5%(+6.14)#5,144 |
| 52. | 57107 | 25.6% | 17.8%(+7.82)#52 | 19.5%(+6.10)#5,175 |
| 53. | 57567 | 25.3% | 17.8%(+7.51)#53 | 19.5%(+5.79)#5,425 |
| 54. | 57799 | 25.0% | 17.8%(+7.22)#54 | 19.5%(+5.50)#5,664 |
| 55. | 57576 | 25.0% | 17.8%(+7.22)#55 | 19.5%(+5.50)#5,706 |
| 56. | 57716 | 24.7% | 17.8%(+6.96)#56 | 19.5%(+5.24)#5,907 |
| 57. | 57317 | 24.7% | 17.8%(+6.92)#57 | 19.5%(+5.21)#5,942 |
| 58. | 57454 | 24.7% | 17.8%(+6.88)#58 | 19.5%(+5.16)#5,987 |
| 59. | 57376 | 24.6% | 17.8%(+6.86)#59 | 19.5%(+5.14)#6,003 |
| 60. | 57543 | 24.6% | 17.8%(+6.86)#60 | 19.5%(+5.14)#6,004 |
| 61. | 57005 | 24.5% | 17.8%(+6.68)#61 | 19.5%(+4.96)#6,165 |
| 62. | 57041 | 24.4% | 17.8%(+6.66)#62 | 19.5%(+4.95)#6,183 |
| 63. | 57379 | 24.4% | 17.8%(+6.61)#63 | 19.5%(+4.89)#6,234 |
| 64. | 57719 | 24.3% | 17.8%(+6.52)#64 | 19.5%(+4.80)#6,300 |
| 65. | 57106 | 24.2% | 17.8%(+6.46)#65 | 19.5%(+4.74)#6,369 |
| 66. | 57657 | 24.0% | 17.8%(+6.22)#66 | 19.5%(+4.50)#6,606 |
| 67. | 57015 | 24.0% | 17.8%(+6.19)#67 | 19.5%(+4.47)#6,636 |
| 68. | 57243 | 23.9% | 17.8%(+6.10)#68 | 19.5%(+4.38)#6,732 |
| 69. | 57025 | 23.8% | 17.8%(+5.98)#69 | 19.5%(+4.26)#6,847 |
| 70. | 57441 | 23.4% | 17.8%(+5.61)#70 | 19.5%(+3.89)#7,236 |
| 71. | 57057 | 22.9% | 17.8%(+5.08)#71 | 19.5%(+3.36)#7,803 |
| 72. | 57233 | 22.7% | 17.8%(+4.95)#72 | 19.5%(+3.23)#7,946 |
| 73. | 57640 | 22.7% | 17.8%(+4.95)#73 | 19.5%(+3.23)#7,951 |
| 74. | 57001 | 22.5% | 17.8%(+4.74)#74 | 19.5%(+3.03)#8,170 |
| 75. | 57039 | 22.5% | 17.8%(+4.70)#75 | 19.5%(+2.99)#8,212 |
| 76. | 57370 | 22.3% | 17.8%(+4.53)#76 | 19.5%(+2.81)#8,421 |
| 77. | 57787 | 22.2% | 17.8%(+4.44)#77 | 19.5%(+2.72)#8,522 |
| 78. | 57651 | 22.2% | 17.8%(+4.44)#78 | 19.5%(+2.72)#8,546 |
| 79. | 57430 | 22.2% | 17.8%(+4.37)#79 | 19.5%(+2.65)#8,608 |
| 80. | 57062 | 22.0% | 17.8%(+4.19)#80 | 19.5%(+2.48)#8,850 |
| 81. | 57103 | 21.9% | 17.8%(+4.10)#81 | 19.5%(+2.38)#8,973 |
| 82. | 57017 | 21.8% | 17.8%(+3.97)#82 | 19.5%(+2.26)#9,142 |
| 83. | 57108 | 21.6% | 17.8%(+3.81)#83 | 19.5%(+2.09)#9,358 |
| 84. | 57448 | 21.3% | 17.8%(+3.51)#84 | 19.5%(+1.80)#9,745 |
| 85. | 57401 | 21.2% | 17.8%(+3.44)#85 | 19.5%(+1.72)#9,846 |
| 86. | 57477 | 21.2% | 17.8%(+3.43)#86 | 19.5%(+1.71)#9,870 |
| 87. | 57577 | 21.2% | 17.8%(+3.39)#87 | 19.5%(+1.67)#9,937 |
| 88. | 57536 | 21.1% | 17.8%(+3.27)#88 | 19.5%(+1.55)#10,085 |
| 89. | 57531 | 21.1% | 17.8%(+3.27)#89 | 19.5%(+1.55)#10,092 |
| 90. | 57501 | 20.9% | 17.8%(+3.15)#90 | 19.5%(+1.43)#10,243 |
| 91. | 57735 | 20.9% | 17.8%(+3.13)#91 | 19.5%(+1.41)#10,277 |
| 92. | 57321 | 20.8% | 17.8%(+3.05)#92 | 19.5%(+1.33)#10,403 |
| 93. | 57369 | 20.7% | 17.8%(+2.91)#93 | 19.5%(+1.20)#10,608 |
| 94. | 57068 | 20.6% | 17.8%(+2.82)#94 | 19.5%(+1.10)#10,749 |
| 95. | 57420 | 20.5% | 17.8%(+2.73)#95 | 19.5%(+1.01)#10,872 |
| 96. | 57451 | 20.4% | 17.8%(+2.63)#96 | 19.5%(+0.916)#11,007 |
| 97. | 57580 | 20.2% | 17.8%(+2.46)#97 | 19.5%(+0.744)#11,248 |
| 98. | 57067 | 20.0% | 17.8%(+2.22)#98 | 19.5%(+0.501)#11,637 |
| 99. | 57722 | 20.0% | 17.8%(+2.22)#99 | 19.5%(+0.501)#11,650 |
| 100. | 57029 | 19.8% | 17.8%(+2.06)#100 | 19.5%(+0.344)#11,842 |
Common Questions
What are the Top 10 Zip Codes with the Highest Percentage of Population with a Degree in Business in South Dakota?
Top 10 Zip Codes with the Highest Percentage of Population with a Degree in Business in South Dakota are:
What zip code has the Highest Percentage of Population with a Degree in Business in South Dakota?
57622 has the Highest Percentage of Population with a Degree in Business in South Dakota with 100.0%.
What is the Percentage of Population with a Degree in Business in the State of South Dakota?
Percentage of Population with a Degree in Business in South Dakota is 17.8%.
What is the Percentage of Population with a Degree in Business in the United States?
Percentage of Population with a Degree in Business in the United States is 19.5%.