Zip Codes with the Highest Percentage of Swedish Population in South Dakota
RELATED REPORTS & OPTIONS
Swedish
South Dakota
Compare Zip Codes
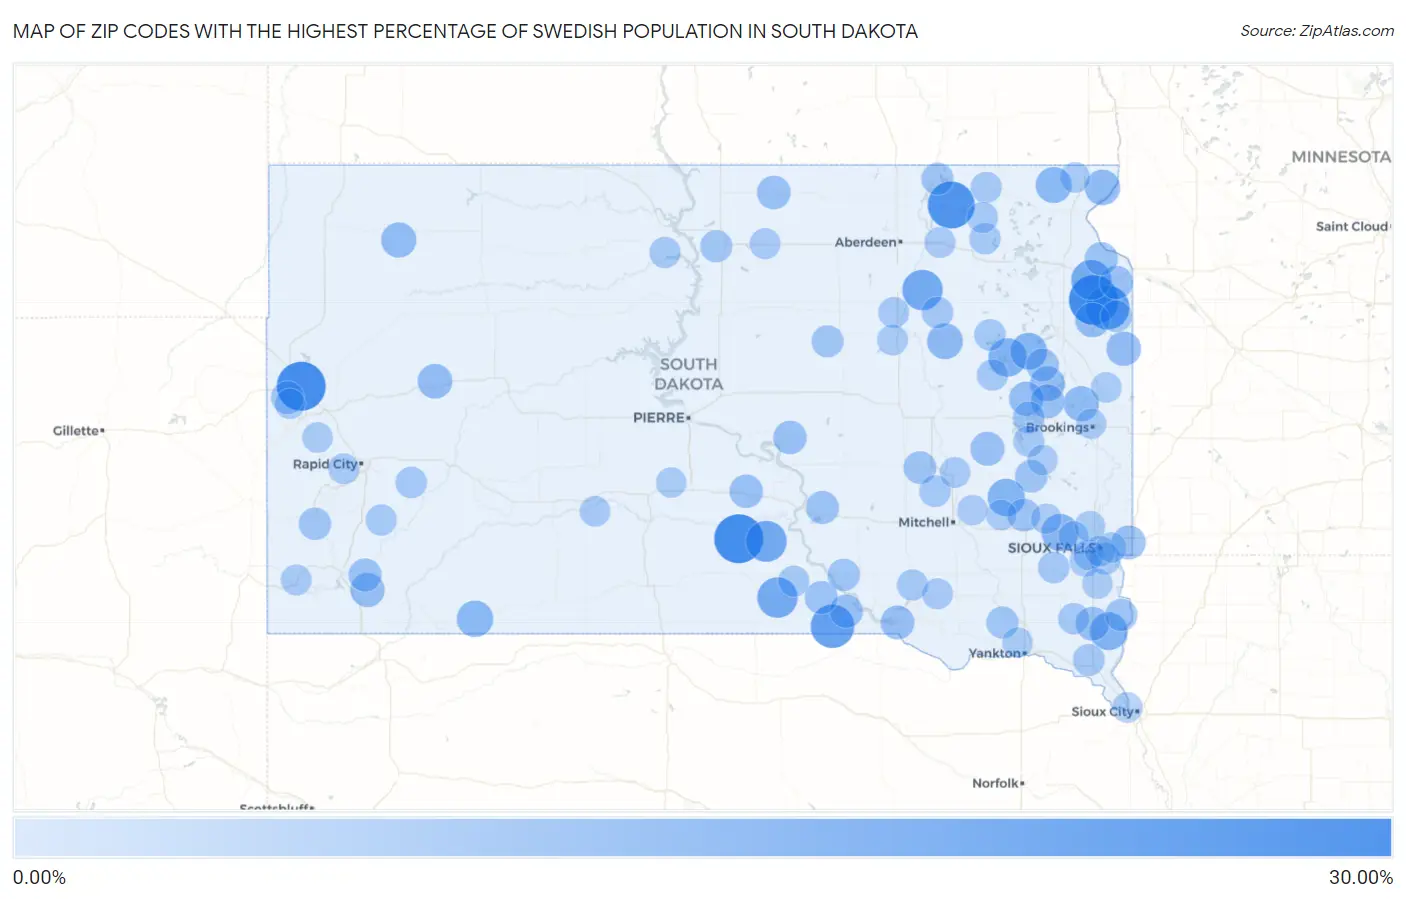
Map of Zip Codes with the Highest Percentage of Swedish Population in South Dakota
0.00%
30.00%
Zip Codes with the Highest Percentage of Swedish Population in South Dakota
| Zip Code | Swedish | vs State | vs National | |
| 1. | 57264 | 26.98% | 2.77%(+24.2)#1 | 1.05%(+25.9)#57 |
| 2. | 57541 | 26.29% | 2.77%(+23.5)#2 | 1.05%(+25.2)#66 |
| 3. | 57779 | 26.22% | 2.77%(+23.4)#3 | 1.05%(+25.2)#68 |
| 4. | 57432 | 23.85% | 2.77%(+21.1)#4 | 1.05%(+22.8)#85 |
| 5. | 57246 | 20.00% | 2.77%(+17.2)#5 | 1.05%(+19.0)#115 |
| 6. | 57571 | 19.35% | 2.77%(+16.6)#6 | 1.05%(+18.3)#131 |
| 7. | 57534 | 16.22% | 2.77%(+13.4)#7 | 1.05%(+15.2)#198 |
| 8. | 57529 | 15.50% | 2.77%(+12.7)#8 | 1.05%(+14.4)#234 |
| 9. | 57429 | 15.49% | 2.77%(+12.7)#9 | 1.05%(+14.4)#235 |
| 10. | 57269 | 15.08% | 2.77%(+12.3)#10 | 1.05%(+14.0)#260 |
| 11. | 57271 | 12.95% | 2.77%(+10.2)#11 | 1.05%(+11.9)#375 |
| 12. | 57001 | 12.19% | 2.77%(+9.42)#12 | 1.05%(+11.1)#428 |
| 13. | 57321 | 11.70% | 2.77%(+8.93)#13 | 1.05%(+10.6)#458 |
| 14. | 57035 | 11.30% | 2.77%(+8.53)#14 | 1.05%(+10.3)#491 |
| 15. | 57242 | 11.08% | 2.77%(+8.31)#15 | 1.05%(+10.0)#513 |
| 16. | 57716 | 10.50% | 2.77%(+7.73)#16 | 1.05%(+9.45)#578 |
| 17. | 57224 | 10.12% | 2.77%(+7.35)#17 | 1.05%(+9.07)#623 |
| 18. | 57436 | 9.73% | 2.77%(+6.96)#18 | 1.05%(+8.68)#669 |
| 19. | 57260 | 9.33% | 2.77%(+6.56)#19 | 1.05%(+8.28)#727 |
| 20. | 57220 | 9.11% | 2.77%(+6.34)#20 | 1.05%(+8.06)#767 |
| 21. | 57649 | 9.02% | 2.77%(+6.25)#21 | 1.05%(+7.97)#787 |
| 22. | 57248 | 8.49% | 2.77%(+5.72)#22 | 1.05%(+7.45)#862 |
| 23. | 57787 | 8.42% | 2.77%(+5.65)#23 | 1.05%(+7.37)#877 |
| 24. | 57265 | 8.33% | 2.77%(+5.56)#24 | 1.05%(+7.28)#891 |
| 25. | 57237 | 8.25% | 2.77%(+5.48)#25 | 1.05%(+7.20)#914 |
| 26. | 57782 | 7.94% | 2.77%(+5.17)#26 | 1.05%(+6.89)#977 |
| 27. | 57233 | 7.78% | 2.77%(+5.01)#27 | 1.05%(+6.73)#1,008 |
| 28. | 57323 | 7.55% | 2.77%(+4.78)#28 | 1.05%(+6.50)#1,071 |
| 29. | 57068 | 7.44% | 2.77%(+4.67)#29 | 1.05%(+6.39)#1,094 |
| 30. | 57214 | 7.39% | 2.77%(+4.62)#30 | 1.05%(+6.34)#1,110 |
| 31. | 57004 | 7.31% | 2.77%(+4.54)#31 | 1.05%(+6.26)#1,138 |
| 32. | 57367 | 7.27% | 2.77%(+4.50)#32 | 1.05%(+6.22)#1,153 |
| 33. | 57437 | 7.17% | 2.77%(+4.40)#33 | 1.05%(+6.13)#1,176 |
| 34. | 57252 | 6.98% | 2.77%(+4.21)#34 | 1.05%(+5.93)#1,232 |
| 35. | 57346 | 6.98% | 2.77%(+4.21)#35 | 1.05%(+5.93)#1,236 |
| 36. | 57544 | 6.87% | 2.77%(+4.10)#36 | 1.05%(+5.83)#1,263 |
| 37. | 57317 | 6.86% | 2.77%(+4.09)#37 | 1.05%(+5.82)#1,271 |
| 38. | 57227 | 6.65% | 2.77%(+3.88)#38 | 1.05%(+5.61)#1,343 |
| 39. | 57766 | 6.50% | 2.77%(+3.73)#39 | 1.05%(+5.46)#1,397 |
| 40. | 57370 | 6.50% | 2.77%(+3.72)#40 | 1.05%(+5.45)#1,401 |
| 41. | 57523 | 6.40% | 2.77%(+3.63)#41 | 1.05%(+5.36)#1,429 |
| 42. | 57058 | 6.26% | 2.77%(+3.49)#42 | 1.05%(+5.21)#1,487 |
| 43. | 57241 | 6.21% | 2.77%(+3.44)#43 | 1.05%(+5.16)#1,507 |
| 44. | 57799 | 6.02% | 2.77%(+3.25)#44 | 1.05%(+4.97)#1,565 |
| 45. | 57385 | 5.99% | 2.77%(+3.22)#45 | 1.05%(+4.94)#1,571 |
| 46. | 57076 | 5.97% | 2.77%(+3.20)#46 | 1.05%(+4.92)#1,583 |
| 47. | 57730 | 5.66% | 2.77%(+2.89)#47 | 1.05%(+4.62)#1,701 |
| 48. | 57369 | 5.65% | 2.77%(+2.88)#48 | 1.05%(+4.60)#1,703 |
| 49. | 57034 | 5.52% | 2.77%(+2.75)#49 | 1.05%(+4.47)#1,746 |
| 50. | 57446 | 5.41% | 2.77%(+2.64)#50 | 1.05%(+4.37)#1,786 |
| 51. | 57040 | 5.35% | 2.77%(+2.58)#51 | 1.05%(+4.30)#1,812 |
| 52. | 57472 | 5.29% | 2.77%(+2.52)#52 | 1.05%(+4.24)#1,832 |
| 53. | 57467 | 5.18% | 2.77%(+2.41)#53 | 1.05%(+4.13)#1,906 |
| 54. | 57249 | 4.95% | 2.77%(+2.18)#54 | 1.05%(+3.90)#2,058 |
| 55. | 57259 | 4.79% | 2.77%(+2.02)#55 | 1.05%(+3.74)#2,157 |
| 56. | 57108 | 4.77% | 2.77%(+2.00)#56 | 1.05%(+3.73)#2,170 |
| 57. | 57010 | 4.73% | 2.77%(+1.96)#57 | 1.05%(+3.68)#2,199 |
| 58. | 57477 | 4.69% | 2.77%(+1.92)#58 | 1.05%(+3.64)#2,214 |
| 59. | 57053 | 4.59% | 2.77%(+1.82)#59 | 1.05%(+3.55)#2,270 |
| 60. | 57225 | 4.58% | 2.77%(+1.81)#60 | 1.05%(+3.54)#2,278 |
| 61. | 57359 | 4.58% | 2.77%(+1.80)#61 | 1.05%(+3.53)#2,282 |
| 62. | 57725 | 4.49% | 2.77%(+1.72)#62 | 1.05%(+3.44)#2,344 |
| 63. | 57014 | 4.37% | 2.77%(+1.60)#63 | 1.05%(+3.32)#2,437 |
| 64. | 57468 | 4.33% | 2.77%(+1.56)#64 | 1.05%(+3.28)#2,461 |
| 65. | 57278 | 4.22% | 2.77%(+1.45)#65 | 1.05%(+3.17)#2,568 |
| 66. | 57601 | 4.21% | 2.77%(+1.44)#66 | 1.05%(+3.16)#2,573 |
| 67. | 57744 | 4.06% | 2.77%(+1.29)#67 | 1.05%(+3.01)#2,698 |
| 68. | 57313 | 4.02% | 2.77%(+1.25)#68 | 1.05%(+2.98)#2,726 |
| 69. | 57533 | 4.01% | 2.77%(+1.24)#69 | 1.05%(+2.96)#2,737 |
| 70. | 57430 | 4.00% | 2.77%(+1.23)#70 | 1.05%(+2.95)#2,745 |
| 71. | 57454 | 3.99% | 2.77%(+1.22)#71 | 1.05%(+2.95)#2,758 |
| 72. | 57051 | 3.98% | 2.77%(+1.21)#72 | 1.05%(+2.93)#2,766 |
| 73. | 57424 | 3.92% | 2.77%(+1.15)#73 | 1.05%(+2.87)#2,814 |
| 74. | 57445 | 3.87% | 2.77%(+1.10)#74 | 1.05%(+2.83)#2,859 |
| 75. | 57735 | 3.84% | 2.77%(+1.07)#75 | 1.05%(+2.79)#2,891 |
| 76. | 57064 | 3.84% | 2.77%(+1.07)#76 | 1.05%(+2.79)#2,893 |
| 77. | 57330 | 3.83% | 2.77%(+1.06)#77 | 1.05%(+2.78)#2,903 |
| 78. | 57428 | 3.82% | 2.77%(+1.04)#78 | 1.05%(+2.77)#2,922 |
| 79. | 57702 | 3.67% | 2.77%(+0.902)#79 | 1.05%(+2.62)#3,082 |
| 80. | 57469 | 3.63% | 2.77%(+0.864)#80 | 1.05%(+2.59)#3,126 |
| 81. | 57314 | 3.55% | 2.77%(+0.779)#81 | 1.05%(+2.50)#3,223 |
| 82. | 57106 | 3.55% | 2.77%(+0.776)#82 | 1.05%(+2.50)#3,226 |
| 83. | 57521 | 3.48% | 2.77%(+0.712)#83 | 1.05%(+2.43)#3,299 |
| 84. | 57268 | 3.46% | 2.77%(+0.691)#84 | 1.05%(+2.41)#3,316 |
| 85. | 57197 | 3.45% | 2.77%(+0.678)#85 | 1.05%(+2.40)#3,334 |
| 86. | 57374 | 3.45% | 2.77%(+0.678)#86 | 1.05%(+2.40)#3,337 |
| 87. | 57732 | 3.45% | 2.77%(+0.676)#87 | 1.05%(+2.40)#3,339 |
| 88. | 57049 | 3.43% | 2.77%(+0.662)#88 | 1.05%(+2.38)#3,358 |
| 89. | 57054 | 3.42% | 2.77%(+0.654)#89 | 1.05%(+2.38)#3,367 |
| 90. | 57020 | 3.40% | 2.77%(+0.624)#90 | 1.05%(+2.35)#3,399 |
| 91. | 57110 | 3.39% | 2.77%(+0.621)#91 | 1.05%(+2.34)#3,403 |
| 92. | 57077 | 3.26% | 2.77%(+0.492)#92 | 1.05%(+2.21)#3,576 |
| 93. | 57078 | 3.26% | 2.77%(+0.491)#93 | 1.05%(+2.21)#3,578 |
| 94. | 57033 | 3.26% | 2.77%(+0.485)#94 | 1.05%(+2.21)#3,586 |
| 95. | 57006 | 3.25% | 2.77%(+0.481)#95 | 1.05%(+2.20)#3,591 |
| 96. | 57048 | 3.23% | 2.77%(+0.463)#96 | 1.05%(+2.18)#3,610 |
| 97. | 57255 | 3.23% | 2.77%(+0.461)#97 | 1.05%(+2.18)#3,613 |
| 98. | 57783 | 3.23% | 2.77%(+0.459)#98 | 1.05%(+2.18)#3,614 |
| 99. | 57340 | 3.23% | 2.77%(+0.455)#99 | 1.05%(+2.18)#3,623 |
| 100. | 57531 | 3.23% | 2.77%(+0.455)#100 | 1.05%(+2.18)#3,624 |
Common Questions
What are the Top 10 Zip Codes with the Highest Percentage of Swedish Population in South Dakota?
Top 10 Zip Codes with the Highest Percentage of Swedish Population in South Dakota are:
What zip code has the Highest Percentage of Swedish Population in South Dakota?
57264 has the Highest Percentage of Swedish Population in South Dakota with 26.98%.
What is the Percentage of Swedish Population in the State of South Dakota?
Percentage of Swedish Population in South Dakota is 2.77%.
What is the Percentage of Swedish Population in the United States?
Percentage of Swedish Population in the United States is 1.05%.