Zip Codes with the Highest Percentage of Population Employed in Sales & Related in South Dakota
RELATED REPORTS & OPTIONS
Sales & Related
South Dakota
Compare Zip Codes
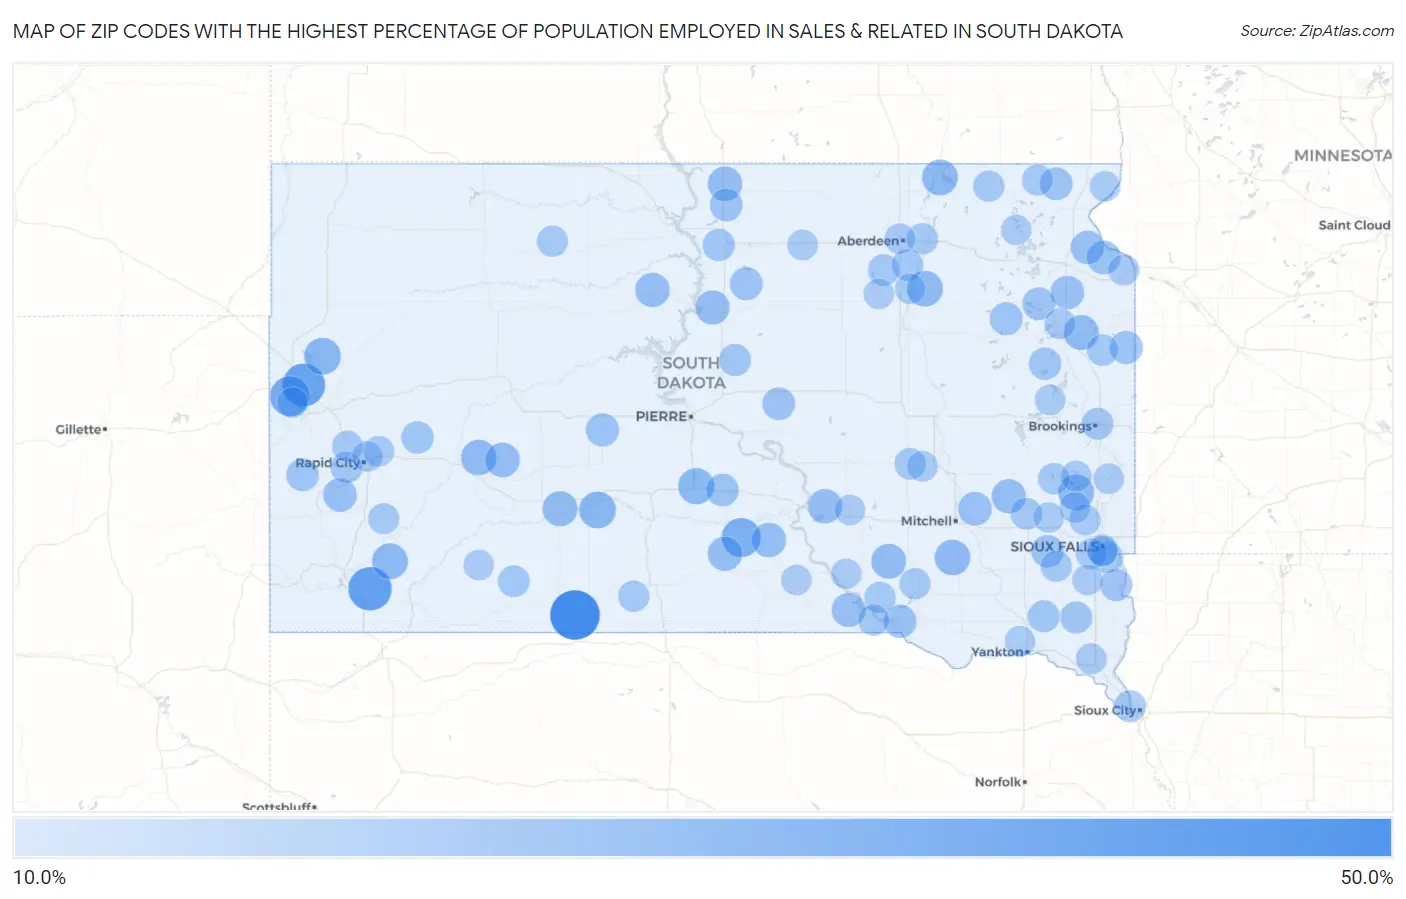
Map of Zip Codes with the Highest Percentage of Population Employed in Sales & Related in South Dakota
10.0%
50.0%
Zip Codes with the Highest Percentage of Population Employed in Sales & Related in South Dakota
| Zip Code | % Employed | vs State | vs National | |
| 1. | 57574 | 50.0% | 9.3%(+40.7)#1 | 9.6%(+40.4)#107 |
| 2. | 57782 | 36.8% | 9.3%(+27.6)#2 | 9.6%(+27.2)#243 |
| 3. | 57779 | 35.4% | 9.3%(+26.1)#3 | 9.6%(+25.8)#264 |
| 4. | 57799 | 29.8% | 9.3%(+20.5)#4 | 9.6%(+20.2)#410 |
| 5. | 57541 | 28.0% | 9.3%(+18.7)#5 | 9.6%(+18.4)#476 |
| 6. | 57762 | 23.1% | 9.3%(+13.9)#6 | 9.6%(+13.5)#780 |
| 7. | 57521 | 23.1% | 9.3%(+13.8)#7 | 9.6%(+13.5)#789 |
| 8. | 57576 | 21.8% | 9.3%(+12.5)#8 | 9.6%(+12.2)#916 |
| 9. | 57016 | 21.4% | 9.3%(+12.1)#9 | 9.6%(+11.8)#980 |
| 10. | 57446 | 21.2% | 9.3%(+11.9)#10 | 9.6%(+11.6)#996 |
| 11. | 57722 | 21.1% | 9.3%(+11.8)#11 | 9.6%(+11.5)#1,004 |
| 12. | 57429 | 20.9% | 9.3%(+11.6)#12 | 9.6%(+11.3)#1,023 |
| 13. | 57331 | 20.7% | 9.3%(+11.4)#13 | 9.6%(+11.1)#1,070 |
| 14. | 57790 | 20.3% | 9.3%(+11.0)#14 | 9.6%(+10.7)#1,107 |
| 15. | 57543 | 19.5% | 9.3%(+10.3)#15 | 9.6%(+9.94)#1,227 |
| 16. | 57245 | 19.3% | 9.3%(+10.0)#16 | 9.6%(+9.73)#1,272 |
| 17. | 57344 | 19.2% | 9.3%(+9.95)#17 | 9.6%(+9.64)#1,294 |
| 18. | 57775 | 18.5% | 9.3%(+9.22)#18 | 9.6%(+8.90)#1,437 |
| 19. | 57632 | 18.4% | 9.3%(+9.11)#19 | 9.6%(+8.80)#1,462 |
| 20. | 57534 | 18.4% | 9.3%(+9.08)#20 | 9.6%(+8.77)#1,470 |
| 21. | 57652 | 18.2% | 9.3%(+8.90)#21 | 9.6%(+8.59)#1,523 |
| 22. | 57584 | 18.2% | 9.3%(+8.90)#22 | 9.6%(+8.59)#1,534 |
| 23. | 57370 | 18.2% | 9.3%(+8.88)#23 | 9.6%(+8.56)#1,539 |
| 24. | 57321 | 17.7% | 9.3%(+8.45)#24 | 9.6%(+8.14)#1,635 |
| 25. | 57442 | 17.6% | 9.3%(+8.33)#25 | 9.6%(+8.02)#1,663 |
| 26. | 57317 | 17.5% | 9.3%(+8.24)#26 | 9.6%(+7.92)#1,688 |
| 27. | 57340 | 16.7% | 9.3%(+7.38)#27 | 9.6%(+7.07)#1,951 |
| 28. | 57751 | 16.6% | 9.3%(+7.35)#28 | 9.6%(+7.04)#1,969 |
| 29. | 57227 | 16.6% | 9.3%(+7.29)#29 | 9.6%(+6.98)#1,989 |
| 30. | 57263 | 16.4% | 9.3%(+7.10)#30 | 9.6%(+6.78)#2,069 |
| 31. | 57279 | 16.2% | 9.3%(+6.90)#31 | 9.6%(+6.59)#2,153 |
| 32. | 57552 | 15.9% | 9.3%(+6.63)#32 | 9.6%(+6.31)#2,272 |
| 33. | 57367 | 15.6% | 9.3%(+6.27)#33 | 9.6%(+5.96)#2,439 |
| 34. | 57237 | 15.4% | 9.3%(+6.08)#34 | 9.6%(+5.77)#2,545 |
| 35. | 57236 | 15.3% | 9.3%(+5.97)#35 | 9.6%(+5.66)#2,601 |
| 36. | 57450 | 15.1% | 9.3%(+5.80)#36 | 9.6%(+5.48)#2,685 |
| 37. | 57646 | 14.8% | 9.3%(+5.56)#37 | 9.6%(+5.25)#2,840 |
| 38. | 57235 | 14.8% | 9.3%(+5.55)#38 | 9.6%(+5.24)#2,847 |
| 39. | 57224 | 14.7% | 9.3%(+5.42)#39 | 9.6%(+5.11)#2,935 |
| 40. | 57540 | 14.6% | 9.3%(+5.35)#40 | 9.6%(+5.04)#2,989 |
| 41. | 57047 | 14.6% | 9.3%(+5.30)#41 | 9.6%(+4.99)#3,028 |
| 42. | 57568 | 14.4% | 9.3%(+5.14)#42 | 9.6%(+4.83)#3,139 |
| 43. | 57745 | 14.3% | 9.3%(+5.05)#43 | 9.6%(+4.73)#3,213 |
| 44. | 57241 | 14.2% | 9.3%(+4.88)#44 | 9.6%(+4.57)#3,346 |
| 45. | 57761 | 14.1% | 9.3%(+4.80)#45 | 9.6%(+4.48)#3,413 |
| 46. | 57013 | 13.7% | 9.3%(+4.45)#46 | 9.6%(+4.14)#3,713 |
| 47. | 57472 | 13.7% | 9.3%(+4.39)#47 | 9.6%(+4.07)#3,779 |
| 48. | 57564 | 13.6% | 9.3%(+4.27)#48 | 9.6%(+3.96)#3,890 |
| 49. | 57014 | 13.3% | 9.3%(+4.06)#49 | 9.6%(+3.75)#4,112 |
| 50. | 57049 | 13.0% | 9.3%(+3.69)#50 | 9.6%(+3.38)#4,512 |
| 51. | 57037 | 12.9% | 9.3%(+3.63)#51 | 9.6%(+3.32)#4,582 |
| 52. | 57007 | 12.8% | 9.3%(+3.53)#52 | 9.6%(+3.21)#4,731 |
| 53. | 57058 | 12.8% | 9.3%(+3.47)#53 | 9.6%(+3.16)#4,819 |
| 54. | 57714 | 12.6% | 9.3%(+3.28)#54 | 9.6%(+2.97)#5,066 |
| 55. | 57358 | 12.5% | 9.3%(+3.22)#55 | 9.6%(+2.90)#5,194 |
| 56. | 57460 | 12.4% | 9.3%(+3.14)#56 | 9.6%(+2.83)#5,285 |
| 57. | 57108 | 12.4% | 9.3%(+3.08)#57 | 9.6%(+2.77)#5,380 |
| 58. | 57479 | 12.2% | 9.3%(+2.93)#58 | 9.6%(+2.62)#5,636 |
| 59. | 57226 | 12.1% | 9.3%(+2.83)#59 | 9.6%(+2.52)#5,837 |
| 60. | 57702 | 12.1% | 9.3%(+2.78)#60 | 9.6%(+2.47)#5,934 |
| 61. | 57042 | 11.9% | 9.3%(+2.65)#61 | 9.6%(+2.34)#6,157 |
| 62. | 57342 | 11.9% | 9.3%(+2.61)#62 | 9.6%(+2.29)#6,255 |
| 63. | 57427 | 11.7% | 9.3%(+2.46)#63 | 9.6%(+2.15)#6,505 |
| 64. | 57633 | 11.7% | 9.3%(+2.43)#64 | 9.6%(+2.12)#6,581 |
| 65. | 57570 | 11.7% | 9.3%(+2.40)#65 | 9.6%(+2.08)#6,641 |
| 66. | 57430 | 11.6% | 9.3%(+2.30)#66 | 9.6%(+1.99)#6,840 |
| 67. | 57270 | 11.6% | 9.3%(+2.30)#67 | 9.6%(+1.98)#6,849 |
| 68. | 57053 | 11.5% | 9.3%(+2.23)#68 | 9.6%(+1.92)#6,979 |
| 69. | 57197 | 11.5% | 9.3%(+2.23)#69 | 9.6%(+1.92)#6,986 |
| 70. | 57335 | 11.5% | 9.3%(+2.18)#70 | 9.6%(+1.86)#7,115 |
| 71. | 57313 | 11.3% | 9.3%(+2.04)#71 | 9.6%(+1.73)#7,417 |
| 72. | 57718 | 11.3% | 9.3%(+2.00)#72 | 9.6%(+1.69)#7,512 |
| 73. | 57744 | 11.3% | 9.3%(+1.99)#73 | 9.6%(+1.68)#7,546 |
| 74. | 57075 | 11.1% | 9.3%(+1.85)#74 | 9.6%(+1.53)#7,874 |
| 75. | 57216 | 11.0% | 9.3%(+1.76)#75 | 9.6%(+1.45)#8,107 |
| 76. | 57041 | 11.0% | 9.3%(+1.69)#76 | 9.6%(+1.38)#8,279 |
| 77. | 57201 | 11.0% | 9.3%(+1.68)#77 | 9.6%(+1.36)#8,310 |
| 78. | 57018 | 10.9% | 9.3%(+1.62)#78 | 9.6%(+1.31)#8,445 |
| 79. | 57010 | 10.9% | 9.3%(+1.57)#79 | 9.6%(+1.26)#8,574 |
| 80. | 57106 | 10.7% | 9.3%(+1.42)#80 | 9.6%(+1.11)#8,986 |
| 81. | 57039 | 10.6% | 9.3%(+1.31)#81 | 9.6%(+1.00)#9,283 |
| 82. | 57783 | 10.6% | 9.3%(+1.30)#82 | 9.6%(+0.983)#9,336 |
| 83. | 57471 | 10.5% | 9.3%(+1.23)#83 | 9.6%(+0.913)#9,501 |
| 84. | 57401 | 10.5% | 9.3%(+1.22)#84 | 9.6%(+0.904)#9,528 |
| 85. | 57024 | 10.5% | 9.3%(+1.20)#85 | 9.6%(+0.885)#9,579 |
| 86. | 57706 | 10.5% | 9.3%(+1.19)#86 | 9.6%(+0.879)#9,600 |
| 87. | 57701 | 10.5% | 9.3%(+1.18)#87 | 9.6%(+0.869)#9,624 |
| 88. | 57385 | 10.4% | 9.3%(+1.09)#88 | 9.6%(+0.781)#9,882 |
| 89. | 57078 | 10.3% | 9.3%(+1.02)#89 | 9.6%(+0.704)#10,116 |
| 90. | 57260 | 10.3% | 9.3%(+1.01)#90 | 9.6%(+0.702)#10,122 |
| 91. | 57214 | 10.3% | 9.3%(+0.974)#91 | 9.6%(+0.661)#10,234 |
| 92. | 57752 | 10.2% | 9.3%(+0.918)#92 | 9.6%(+0.606)#10,421 |
| 93. | 57261 | 10.1% | 9.3%(+0.809)#93 | 9.6%(+0.497)#10,735 |
| 94. | 57465 | 10.1% | 9.3%(+0.805)#94 | 9.6%(+0.493)#10,743 |
| 95. | 57355 | 10.1% | 9.3%(+0.791)#95 | 9.6%(+0.479)#10,770 |
| 96. | 57533 | 10.1% | 9.3%(+0.785)#96 | 9.6%(+0.472)#10,796 |
| 97. | 57461 | 10.1% | 9.3%(+0.785)#97 | 9.6%(+0.472)#10,797 |
| 98. | 57105 | 10.0% | 9.3%(+0.762)#98 | 9.6%(+0.449)#10,868 |
| 99. | 57048 | 10.0% | 9.3%(+0.758)#99 | 9.6%(+0.446)#10,884 |
| 100. | 57369 | 10.0% | 9.3%(+0.725)#100 | 9.6%(+0.413)#10,974 |
Common Questions
What are the Top 10 Zip Codes with the Highest Percentage of Population Employed in Sales & Related in South Dakota?
Top 10 Zip Codes with the Highest Percentage of Population Employed in Sales & Related in South Dakota are:
What zip code has the Highest Percentage of Population Employed in Sales & Related in South Dakota?
57574 has the Highest Percentage of Population Employed in Sales & Related in South Dakota with 50.0%.
What is the Percentage of Population Employed in Sales & Related in the State of South Dakota?
Percentage of Population Employed in Sales & Related in South Dakota is 9.3%.
What is the Percentage of Population Employed in Sales & Related in the United States?
Percentage of Population Employed in Sales & Related in the United States is 9.6%.