Zip Codes with the Highest Percentage of Population Employed in Agriculture, Fishing & Hunting in South Dakota
RELATED REPORTS & OPTIONS
Agriculture, Fishing & Hunting
South Dakota
Compare Zip Codes
Map of Zip Codes with the Highest Percentage of Population Employed in Agriculture, Fishing & Hunting in South Dakota
20.0%
100.0%
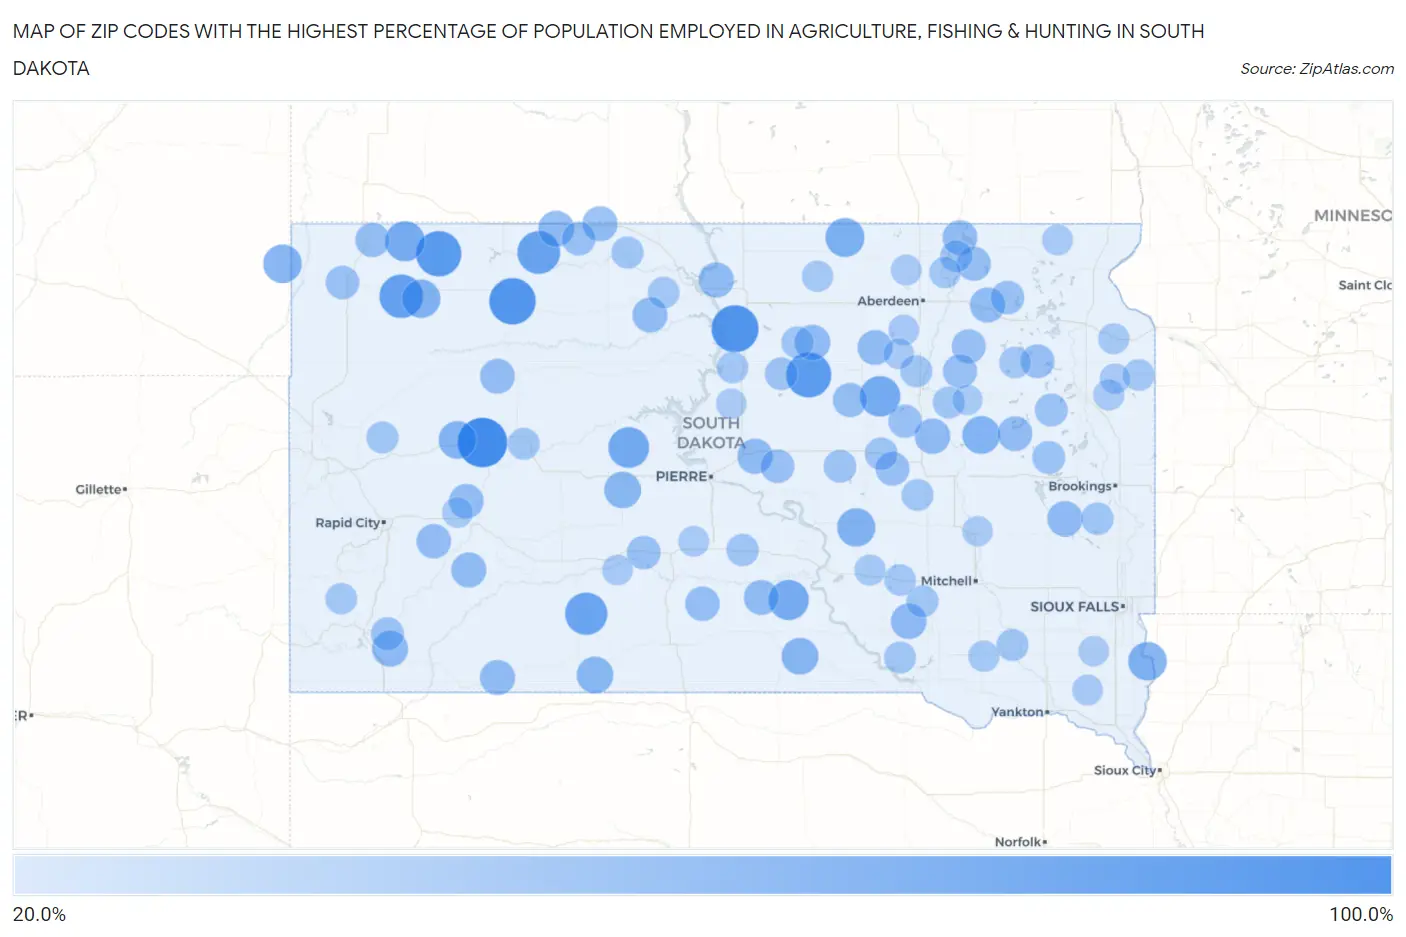
Zip Codes with the Highest Percentage of Population Employed in Agriculture, Fishing & Hunting in South Dakota
| Zip Code | % Employed | vs State | vs National | |
| 1. | 57792 | 100.0% | 5.9% (+94.1)#1 | 1.2% (+98.8)#15 |
| 2. | 57420 | 90.3% | 5.9% (+84.4)#2 | 1.2% (+89.1)#56 |
| 3. | 57644 | 88.0% | 5.9% (+82.1)#3 | 1.2% (+86.8)#61 |
| 4. | 57640 | 83.3% | 5.9% (+77.4)#4 | 1.2% (+82.1)#76 |
| 5. | 57473 | 82.5% | 5.9% (+76.6)#5 | 1.2% (+81.3)#79 |
| 6. | 57651 | 76.9% | 5.9% (+71.0)#6 | 1.2% (+75.7)#91 |
| 7. | 57634 | 73.6% | 5.9% (+67.7)#7 | 1.2% (+72.4)#106 |
| 8. | 57547 | 71.6% | 5.9% (+65.7)#8 | 1.2% (+70.4)#119 |
| 9. | 57537 | 66.0% | 5.9% (+60.1)#9 | 1.2% (+64.8)#162 |
| 10. | 57470 | 65.1% | 5.9% (+59.2)#10 | 1.2% (+63.9)#166 |
| 11. | 57534 | 63.3% | 5.9% (+57.4)#11 | 1.2% (+62.1)#174 |
| 12. | 57650 | 62.5% | 5.9% (+56.6)#12 | 1.2% (+61.3)#183 |
| 13. | 57457 | 58.8% | 5.9% (+52.9)#13 | 1.2% (+57.6)#204 |
| 14. | 57027 | 57.4% | 5.9% (+51.5)#14 | 1.2% (+56.2)#212 |
| 15. | 57724 | 56.8% | 5.9% (+50.9)#15 | 1.2% (+55.6)#218 |
| 16. | 57649 | 56.3% | 5.9% (+50.4)#16 | 1.2% (+55.1)#224 |
| 17. | 57341 | 55.7% | 5.9% (+49.8)#17 | 1.2% (+54.5)#228 |
| 18. | 57322 | 54.3% | 5.9% (+48.5)#18 | 1.2% (+53.1)#238 |
| 19. | 57787 | 53.7% | 5.9% (+47.8)#19 | 1.2% (+52.5)#246 |
| 20. | 57529 | 50.8% | 5.9% (+44.9)#20 | 1.2% (+49.6)#283 |
| 21. | 57574 | 50.0% | 5.9% (+44.1)#21 | 1.2% (+48.8)#299 |
| 22. | 57552 | 49.6% | 5.9% (+43.7)#22 | 1.2% (+48.4)#310 |
| 23. | 57782 | 47.4% | 5.9% (+41.5)#23 | 1.2% (+46.2)#344 |
| 24. | 57645 | 47.3% | 5.9% (+41.4)#24 | 1.2% (+46.1)#347 |
| 25. | 57344 | 46.2% | 5.9% (+40.3)#25 | 1.2% (+45.0)#365 |
| 26. | 57466 | 45.7% | 5.9% (+39.8)#26 | 1.2% (+44.5)#374 |
| 27. | 57054 | 45.2% | 5.9% (+39.3)#27 | 1.2% (+44.0)#379 |
| 28. | 57348 | 45.1% | 5.9% (+39.2)#28 | 1.2% (+43.9)#381 |
| 29. | 57522 | 44.8% | 5.9% (+38.9)#29 | 1.2% (+43.6)#390 |
| 30. | 57631 | 44.4% | 5.9% (+38.5)#30 | 1.2% (+43.2)#402 |
| 31. | 57716 | 44.3% | 5.9% (+38.4)#31 | 1.2% (+43.1)#403 |
| 32. | 57641 | 44.3% | 5.9% (+38.4)#32 | 1.2% (+43.1)#406 |
| 33. | 57780 | 44.1% | 5.9% (+38.2)#33 | 1.2% (+42.9)#410 |
| 34. | 57422 | 43.8% | 5.9% (+37.9)#34 | 1.2% (+42.6)#415 |
| 35. | 57630 | 43.8% | 5.9% (+37.9)#35 | 1.2% (+42.6)#417 |
| 36. | 57541 | 43.2% | 5.9% (+37.3)#36 | 1.2% (+42.0)#429 |
| 37. | 57435 | 43.1% | 5.9% (+37.2)#37 | 1.2% (+41.9)#430 |
| 38. | 57626 | 42.9% | 5.9% (+37.0)#38 | 1.2% (+41.7)#433 |
| 39. | 57278 | 42.9% | 5.9% (+37.0)#39 | 1.2% (+41.7)#436 |
| 40. | 57446 | 42.7% | 5.9% (+36.8)#40 | 1.2% (+41.5)#444 |
| 41. | 57791 | 42.2% | 5.9% (+36.3)#41 | 1.2% (+41.0)#458 |
| 42. | 57725 | 41.8% | 5.9% (+35.9)#42 | 1.2% (+40.6)#466 |
| 43. | 57585 | 41.5% | 5.9% (+35.6)#43 | 1.2% (+40.3)#479 |
| 44. | 57755 | 41.2% | 5.9% (+35.4)#44 | 1.2% (+40.1)#485 |
| 45. | 57432 | 40.8% | 5.9% (+34.9)#45 | 1.2% (+39.6)#494 |
| 46. | 57467 | 40.7% | 5.9% (+34.8)#46 | 1.2% (+39.5)#496 |
| 47. | 57434 | 40.0% | 5.9% (+34.1)#47 | 1.2% (+38.8)#508 |
| 48. | 57477 | 40.0% | 5.9% (+34.1)#48 | 1.2% (+38.8)#511 |
| 49. | 57381 | 39.3% | 5.9% (+33.4)#49 | 1.2% (+38.1)#528 |
| 50. | 57272 | 39.0% | 5.9% (+33.2)#50 | 1.2% (+37.8)#536 |
| 51. | 57536 | 38.8% | 5.9% (+32.9)#51 | 1.2% (+37.6)#544 |
| 52. | 57562 | 38.6% | 5.9% (+32.7)#52 | 1.2% (+37.4)#545 |
| 53. | 57468 | 38.6% | 5.9% (+32.7)#53 | 1.2% (+37.4)#547 |
| 54. | 57660 | 38.5% | 5.9% (+32.6)#54 | 1.2% (+37.3)#552 |
| 55. | 57720 | 38.3% | 5.9% (+32.4)#55 | 1.2% (+37.1)#557 |
| 56. | 57476 | 37.3% | 5.9% (+31.4)#56 | 1.2% (+36.1)#591 |
| 57. | 57766 | 36.1% | 5.9% (+30.2)#57 | 1.2% (+34.9)#634 |
| 58. | 57242 | 35.8% | 5.9% (+29.9)#58 | 1.2% (+34.6)#647 |
| 59. | 57233 | 35.7% | 5.9% (+29.8)#59 | 1.2% (+34.5)#650 |
| 60. | 57455 | 35.1% | 5.9% (+29.2)#60 | 1.2% (+33.9)#674 |
| 61. | 57373 | 35.0% | 5.9% (+29.1)#61 | 1.2% (+33.8)#676 |
| 62. | 57371 | 34.6% | 5.9% (+28.8)#62 | 1.2% (+33.4)#689 |
| 63. | 57057 | 34.0% | 5.9% (+28.1)#63 | 1.2% (+32.8)#716 |
| 64. | 57475 | 33.3% | 5.9% (+27.4)#64 | 1.2% (+32.1)#747 |
| 65. | 57568 | 33.2% | 5.9% (+27.3)#65 | 1.2% (+32.0)#754 |
| 66. | 57449 | 32.8% | 5.9% (+26.9)#66 | 1.2% (+31.6)#770 |
| 67. | 57375 | 32.7% | 5.9% (+26.8)#67 | 1.2% (+31.5)#777 |
| 68. | 57621 | 32.6% | 5.9% (+26.7)#68 | 1.2% (+31.4)#785 |
| 69. | 57788 | 32.3% | 5.9% (+26.4)#69 | 1.2% (+31.1)#801 |
| 70. | 57424 | 32.3% | 5.9% (+26.4)#70 | 1.2% (+31.1)#802 |
| 71. | 57342 | 32.2% | 5.9% (+26.3)#71 | 1.2% (+31.0)#808 |
| 72. | 57440 | 32.1% | 5.9% (+26.2)#72 | 1.2% (+30.9)#809 |
| 73. | 57052 | 32.1% | 5.9% (+26.2)#73 | 1.2% (+30.9)#810 |
| 74. | 57748 | 31.6% | 5.9% (+25.7)#74 | 1.2% (+30.4)#829 |
| 75. | 57379 | 31.2% | 5.9% (+25.4)#75 | 1.2% (+30.1)#844 |
| 76. | 57259 | 31.0% | 5.9% (+25.1)#76 | 1.2% (+29.8)#853 |
| 77. | 57657 | 31.0% | 5.9% (+25.1)#77 | 1.2% (+29.8)#860 |
| 78. | 57442 | 30.8% | 5.9% (+24.9)#78 | 1.2% (+29.6)#868 |
| 79. | 57773 | 30.6% | 5.9% (+24.8)#79 | 1.2% (+29.4)#875 |
| 80. | 57383 | 30.5% | 5.9% (+24.6)#80 | 1.2% (+29.3)#880 |
| 81. | 57217 | 30.4% | 5.9% (+24.5)#81 | 1.2% (+29.2)#888 |
| 82. | 57433 | 29.9% | 5.9% (+24.1)#82 | 1.2% (+28.7)#919 |
| 83. | 57376 | 29.4% | 5.9% (+23.5)#83 | 1.2% (+28.2)#943 |
| 84. | 57448 | 29.3% | 5.9% (+23.4)#84 | 1.2% (+28.1)#952 |
| 85. | 57269 | 28.8% | 5.9% (+22.9)#85 | 1.2% (+27.6)#978 |
| 86. | 57355 | 28.7% | 5.9% (+22.8)#86 | 1.2% (+27.5)#979 |
| 87. | 57238 | 27.9% | 5.9% (+22.0)#87 | 1.2% (+26.7)#1,015 |
| 88. | 57270 | 27.7% | 5.9% (+21.8)#88 | 1.2% (+26.5)#1,026 |
| 89. | 57531 | 27.7% | 5.9% (+21.8)#89 | 1.2% (+26.5)#1,034 |
| 90. | 57767 | 27.4% | 5.9% (+21.5)#90 | 1.2% (+26.2)#1,053 |
| 91. | 57460 | 27.2% | 5.9% (+21.3)#91 | 1.2% (+26.0)#1,073 |
| 92. | 57465 | 27.2% | 5.9% (+21.3)#92 | 1.2% (+26.0)#1,075 |
| 93. | 57073 | 27.0% | 5.9% (+21.1)#93 | 1.2% (+25.8)#1,084 |
| 94. | 57481 | 27.0% | 5.9% (+21.1)#94 | 1.2% (+25.8)#1,087 |
| 95. | 57521 | 26.9% | 5.9% (+21.0)#95 | 1.2% (+25.7)#1,092 |
| 96. | 57265 | 26.9% | 5.9% (+21.0)#96 | 1.2% (+25.7)#1,095 |
| 97. | 57520 | 26.7% | 5.9% (+20.8)#97 | 1.2% (+25.5)#1,115 |
| 98. | 57314 | 26.6% | 5.9% (+20.7)#98 | 1.2% (+25.4)#1,122 |
| 99. | 57021 | 26.3% | 5.9% (+20.4)#99 | 1.2% (+25.1)#1,140 |
| 100. | 57436 | 26.1% | 5.9% (+20.2)#100 | 1.2% (+24.9)#1,166 |
Common Questions
What are the Top 10 Zip Codes with the Highest Percentage of Population Employed in Agriculture, Fishing & Hunting in South Dakota?
Top 10 Zip Codes with the Highest Percentage of Population Employed in Agriculture, Fishing & Hunting in South Dakota are:
What zip code has the Highest Percentage of Population Employed in Agriculture, Fishing & Hunting in South Dakota?
57792 has the Highest Percentage of Population Employed in Agriculture, Fishing & Hunting in South Dakota with 100.0%.
What is the Percentage of Population Employed in Agriculture, Fishing & Hunting in the State of South Dakota?
Percentage of Population Employed in Agriculture, Fishing & Hunting in South Dakota is 5.9%.
What is the Percentage of Population Employed in Agriculture, Fishing & Hunting in the United States?
Percentage of Population Employed in Agriculture, Fishing & Hunting in the United States is 1.2%.