Zip Codes with the Lowest Owner-Occupied Median Costs of Housing in South Dakota
RELATED REPORTS & OPTIONS
Lowest Owner Housing Costs
South Dakota
Compare Zip Codes
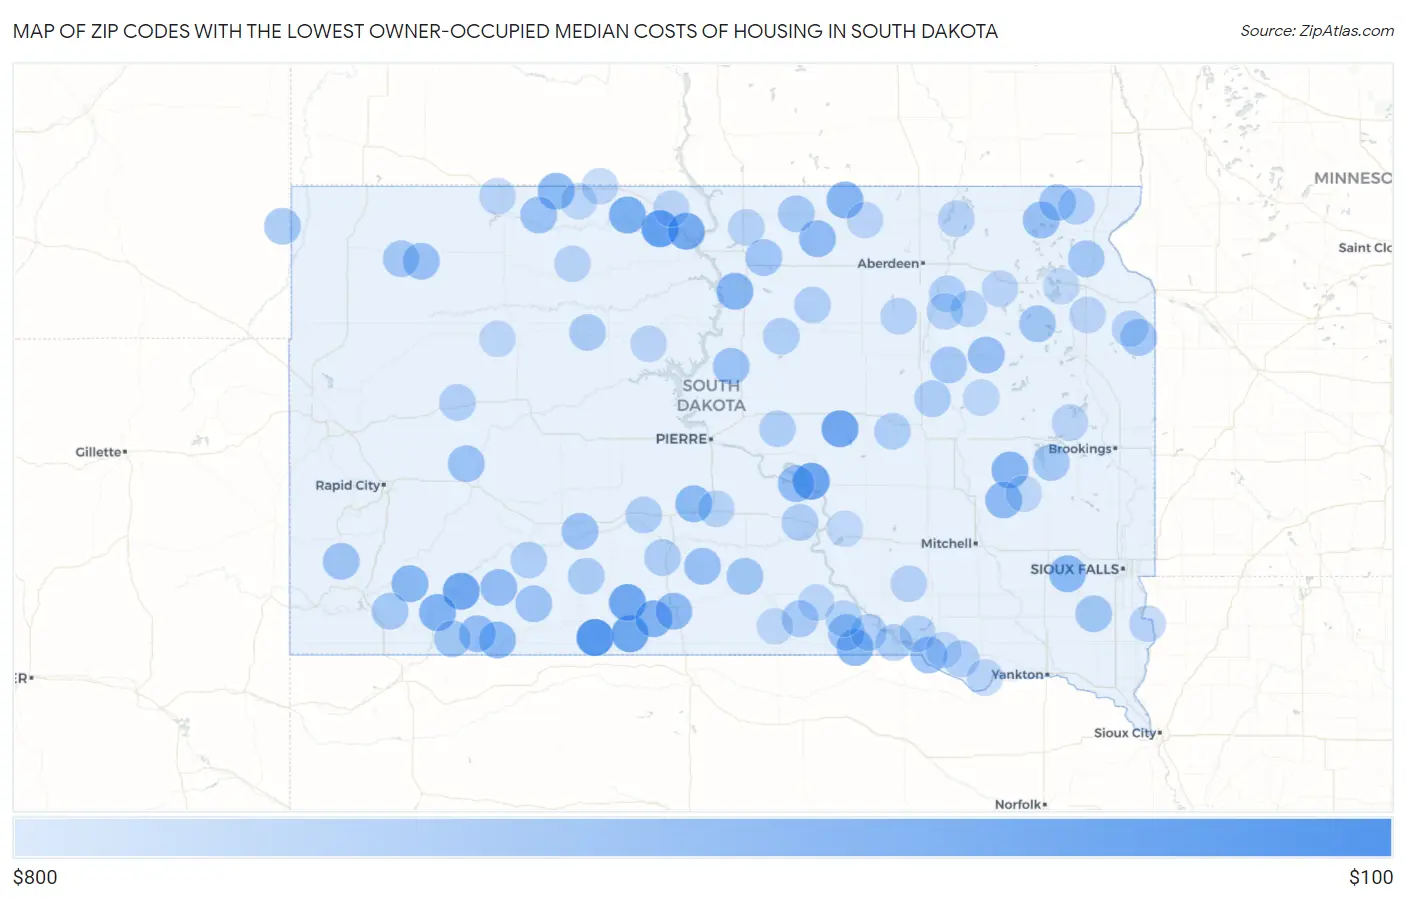
Map of Zip Codes with the Lowest Owner-Occupied Median Costs of Housing in South Dakota
$800
$100
Zip Codes with the Lowest Owner-Occupied Median Costs of Housing in South Dakota
| Zip Code | Housing Costs | vs State | vs National | |
| 1. | 57574 | $161 | $1,028(-867)#1 | $1,282(-1.12k)#26 |
| 2. | 57639 | $213 | $1,028(-815)#2 | $1,282(-1.07k)#113 |
| 3. | 57572 | $259 | $1,028(-769)#3 | $1,282(-1.02k)#226 |
| 4. | 57339 | $259 | $1,028(-769)#4 | $1,282(-1.02k)#227 |
| 5. | 57566 | $268 | $1,028(-760)#5 | $1,282(-1.01k)#265 |
| 6. | 57371 | $273 | $1,028(-755)#6 | $1,282(-1.01k)#290 |
| 7. | 57772 | $274 | $1,028(-754)#7 | $1,282(-1.01k)#294 |
| 8. | 57658 | $300 | $1,028(-728)#8 | $1,282(-982)#412 |
| 9. | 57621 | $325 | $1,028(-703)#9 | $1,282(-957)#509 |
| 10. | 57570 | $342 | $1,028(-686)#10 | $1,282(-940)#611 |
| 11. | 57764 | $359 | $1,028(-669)#11 | $1,282(-923)#763 |
| 12. | 57323 | $373 | $1,028(-655)#12 | $1,282(-909)#929 |
| 13. | 57457 | $375 | $1,028(-653)#13 | $1,282(-907)#964 |
| 14. | 57420 | $376 | $1,028(-652)#14 | $1,282(-906)#971 |
| 15. | 57722 | $382 | $1,028(-646)#15 | $1,282(-900)#1,040 |
| 16. | 57571 | $383 | $1,028(-645)#16 | $1,282(-899)#1,058 |
| 17. | 57716 | $388 | $1,028(-640)#17 | $1,282(-894)#1,129 |
| 18. | 57047 | $388 | $1,028(-640)#18 | $1,282(-894)#1,132 |
| 19. | 57531 | $390 | $1,028(-638)#19 | $1,282(-892)#1,171 |
| 20. | 57645 | $395 | $1,028(-633)#20 | $1,282(-887)#1,251 |
| 21. | 57555 | $403 | $1,028(-625)#21 | $1,282(-879)#1,359 |
| 22. | 57337 | $408 | $1,028(-620)#22 | $1,282(-874)#1,417 |
| 23. | 57448 | $412 | $1,028(-616)#23 | $1,282(-870)#1,468 |
| 24. | 57752 | $427 | $1,028(-601)#24 | $1,282(-855)#1,692 |
| 25. | 57794 | $429 | $1,028(-599)#25 | $1,282(-853)#1,719 |
| 26. | 57548 | $440 | $1,028(-588)#26 | $1,282(-842)#1,900 |
| 27. | 57361 | $446 | $1,028(-582)#27 | $1,282(-836)#2,000 |
| 28. | 57258 | $450 | $1,028(-578)#28 | $1,282(-832)#2,076 |
| 29. | 57247 | $450 | $1,028(-578)#29 | $1,282(-832)#2,082 |
| 30. | 57585 | $450 | $1,028(-578)#30 | $1,282(-832)#2,092 |
| 31. | 57649 | $459 | $1,028(-569)#31 | $1,282(-823)#2,277 |
| 32. | 57520 | $463 | $1,028(-565)#32 | $1,282(-819)#2,363 |
| 33. | 57543 | $465 | $1,028(-563)#33 | $1,282(-817)#2,405 |
| 34. | 57791 | $468 | $1,028(-560)#34 | $1,282(-814)#2,506 |
| 35. | 57634 | $469 | $1,028(-559)#35 | $1,282(-813)#2,536 |
| 36. | 57714 | $475 | $1,028(-553)#36 | $1,282(-807)#2,658 |
| 37. | 57538 | $479 | $1,028(-549)#37 | $1,282(-803)#2,775 |
| 38. | 57773 | $479 | $1,028(-549)#38 | $1,282(-803)#2,776 |
| 39. | 57452 | $480 | $1,028(-548)#39 | $1,282(-802)#2,806 |
| 40. | 57584 | $482 | $1,028(-546)#40 | $1,282(-800)#2,861 |
| 41. | 57270 | $483 | $1,028(-545)#41 | $1,282(-799)#2,880 |
| 42. | 57724 | $485 | $1,028(-543)#42 | $1,282(-797)#2,944 |
| 43. | 57770 | $489 | $1,028(-539)#43 | $1,282(-793)#3,037 |
| 44. | 57021 | $494 | $1,028(-534)#44 | $1,282(-788)#3,187 |
| 45. | 57272 | $496 | $1,028(-532)#45 | $1,282(-786)#3,252 |
| 46. | 57257 | $498 | $1,028(-530)#46 | $1,282(-784)#3,294 |
| 47. | 57259 | $507 | $1,028(-521)#47 | $1,282(-775)#3,471 |
| 48. | 57051 | $509 | $1,028(-519)#48 | $1,282(-773)#3,520 |
| 49. | 57651 | $510 | $1,028(-518)#49 | $1,282(-772)#3,542 |
| 50. | 57437 | $513 | $1,028(-515)#50 | $1,282(-769)#3,585 |
| 51. | 57440 | $514 | $1,028(-514)#51 | $1,282(-768)#3,622 |
| 52. | 57782 | $515 | $1,028(-513)#52 | $1,282(-767)#3,653 |
| 53. | 57529 | $519 | $1,028(-509)#53 | $1,282(-763)#3,716 |
| 54. | 57547 | $529 | $1,028(-499)#54 | $1,282(-753)#3,956 |
| 55. | 57636 | $533 | $1,028(-495)#55 | $1,282(-749)#4,055 |
| 56. | 57348 | $542 | $1,028(-486)#56 | $1,282(-740)#4,258 |
| 57. | 57579 | $543 | $1,028(-485)#57 | $1,282(-739)#4,284 |
| 58. | 57569 | $543 | $1,028(-485)#58 | $1,282(-739)#4,293 |
| 59. | 57455 | $544 | $1,028(-484)#59 | $1,282(-738)#4,320 |
| 60. | 57381 | $546 | $1,028(-482)#60 | $1,282(-736)#4,372 |
| 61. | 57335 | $546 | $1,028(-482)#61 | $1,282(-736)#4,377 |
| 62. | 57536 | $550 | $1,028(-478)#62 | $1,282(-732)#4,487 |
| 63. | 57750 | $550 | $1,028(-478)#63 | $1,282(-732)#4,493 |
| 64. | 57466 | $550 | $1,028(-478)#64 | $1,282(-732)#4,494 |
| 65. | 57562 | $550 | $1,028(-478)#65 | $1,282(-732)#4,504 |
| 66. | 57329 | $554 | $1,028(-474)#66 | $1,282(-728)#4,609 |
| 67. | 57317 | $556 | $1,028(-472)#67 | $1,282(-726)#4,642 |
| 68. | 57474 | $556 | $1,028(-472)#68 | $1,282(-726)#4,649 |
| 69. | 57787 | $557 | $1,028(-471)#69 | $1,282(-725)#4,672 |
| 70. | 57224 | $560 | $1,028(-468)#70 | $1,282(-722)#4,771 |
| 71. | 57356 | $563 | $1,028(-465)#71 | $1,282(-719)#4,833 |
| 72. | 57576 | $563 | $1,028(-465)#72 | $1,282(-719)#4,854 |
| 73. | 57434 | $569 | $1,028(-459)#73 | $1,282(-713)#5,017 |
| 74. | 57523 | $570 | $1,028(-458)#74 | $1,282(-712)#5,045 |
| 75. | 57429 | $572 | $1,028(-456)#75 | $1,282(-710)#5,118 |
| 76. | 57344 | $573 | $1,028(-455)#76 | $1,282(-709)#5,151 |
| 77. | 57465 | $576 | $1,028(-452)#77 | $1,282(-706)#5,235 |
| 78. | 57449 | $576 | $1,028(-452)#78 | $1,282(-706)#5,237 |
| 79. | 57646 | $577 | $1,028(-451)#79 | $1,282(-705)#5,264 |
| 80. | 57246 | $579 | $1,028(-449)#80 | $1,282(-703)#5,332 |
| 81. | 57633 | $584 | $1,028(-444)#81 | $1,282(-698)#5,508 |
| 82. | 57638 | $585 | $1,028(-443)#82 | $1,282(-697)#5,521 |
| 83. | 57641 | $586 | $1,028(-442)#83 | $1,282(-696)#5,567 |
| 84. | 57027 | $589 | $1,028(-439)#84 | $1,282(-693)#5,659 |
| 85. | 57263 | $590 | $1,028(-438)#85 | $1,282(-692)#5,678 |
| 86. | 57642 | $591 | $1,028(-437)#86 | $1,282(-691)#5,702 |
| 87. | 57456 | $591 | $1,028(-437)#87 | $1,282(-691)#5,708 |
| 88. | 57214 | $592 | $1,028(-436)#88 | $1,282(-690)#5,732 |
| 89. | 57062 | $595 | $1,028(-433)#89 | $1,282(-687)#5,819 |
| 90. | 57219 | $596 | $1,028(-432)#90 | $1,282(-686)#5,880 |
| 91. | 57625 | $597 | $1,028(-431)#91 | $1,282(-685)#5,895 |
| 92. | 57533 | $600 | $1,028(-428)#92 | $1,282(-682)#5,982 |
| 93. | 57660 | $600 | $1,028(-428)#93 | $1,282(-682)#6,032 |
| 94. | 57322 | $608 | $1,028(-420)#94 | $1,282(-674)#6,223 |
| 95. | 57626 | $612 | $1,028(-416)#95 | $1,282(-670)#6,313 |
| 96. | 57349 | $615 | $1,028(-413)#96 | $1,282(-667)#6,385 |
| 97. | 57528 | $617 | $1,028(-411)#97 | $1,282(-665)#6,437 |
| 98. | 57370 | $619 | $1,028(-409)#98 | $1,282(-663)#6,504 |
| 99. | 57273 | $620 | $1,028(-408)#99 | $1,282(-662)#6,526 |
| 100. | 57380 | $622 | $1,028(-406)#100 | $1,282(-660)#6,586 |
Common Questions
What are the Top 10 Zip Codes with the Lowest Owner-Occupied Median Costs of Housing in South Dakota?
Top 10 Zip Codes with the Lowest Owner-Occupied Median Costs of Housing in South Dakota are:
What zip code has the Lowest Owner-Occupied Median Costs of Housing in South Dakota?
57574 has the Lowest Owner-Occupied Median Costs of Housing in South Dakota with $161.
What is the Median Renter-Occupied Housing Costs in the State of South Dakota?
Median Renter-Occupied Housing Costs in South Dakota is $1,028.
What is the Median Renter-Occupied Housing Costs in the United States?
Median Renter-Occupied Housing Costs in the United States is $1,282.