Zip Codes with the Highest Percentage of Families with Income Above $100,000 in South Dakota
RELATED REPORTS & OPTIONS
Family Income | $100k+
South Dakota
Compare Zip Codes
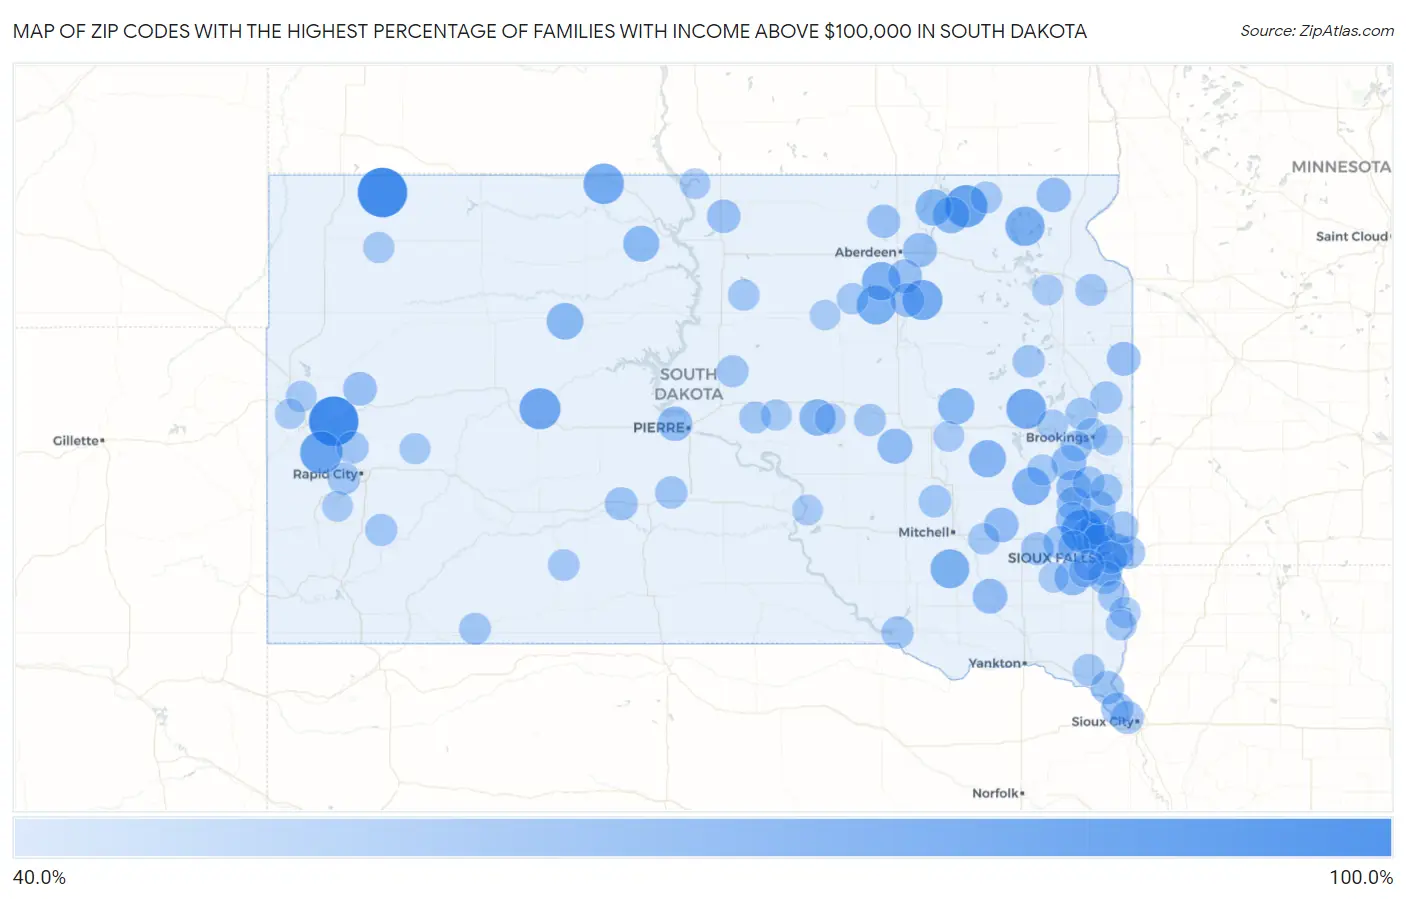
Map of Zip Codes with the Highest Percentage of Families with Income Above $100,000 in South Dakota
40.0%
100.0%
Zip Codes with the Highest Percentage of Families with Income Above $100,000 in South Dakota
| Zip Code | Families with Income > $100k | vs State | vs National | |
| 1. | 57741 | 100.0% | 42.6%(+57.4)#1 | 46.1%(+53.9)#96 |
| 2. | 57650 | 100.0% | 42.6%(+57.4)#2 | 46.1%(+53.9)#257 |
| 3. | 57041 | 80.8% | 42.6%(+38.2)#3 | 46.1%(+34.7)#946 |
| 4. | 57759 | 80.0% | 42.6%(+37.4)#4 | 46.1%(+33.9)#1,034 |
| 5. | 57421 | 80.0% | 42.6%(+37.4)#5 | 46.1%(+33.9)#1,037 |
| 6. | 57553 | 76.6% | 42.6%(+34.0)#6 | 46.1%(+30.5)#1,476 |
| 7. | 57659 | 75.0% | 42.6%(+32.4)#7 | 46.1%(+28.9)#1,716 |
| 8. | 57429 | 73.6% | 42.6%(+31.0)#8 | 46.1%(+27.5)#1,941 |
| 9. | 57233 | 73.3% | 42.6%(+30.7)#9 | 46.1%(+27.2)#2,000 |
| 10. | 57232 | 71.5% | 42.6%(+28.9)#10 | 46.1%(+25.4)#2,317 |
| 11. | 57465 | 71.1% | 42.6%(+28.5)#11 | 46.1%(+25.0)#2,395 |
| 12. | 57331 | 70.2% | 42.6%(+27.6)#12 | 46.1%(+24.1)#2,567 |
| 13. | 57460 | 69.6% | 42.6%(+27.0)#13 | 46.1%(+23.5)#2,703 |
| 14. | 57076 | 67.8% | 42.6%(+25.2)#14 | 46.1%(+21.7)#3,078 |
| 15. | 57323 | 65.5% | 42.6%(+22.9)#15 | 46.1%(+19.4)#3,622 |
| 16. | 57636 | 64.6% | 42.6%(+22.0)#16 | 46.1%(+18.5)#3,863 |
| 17. | 57020 | 64.1% | 42.6%(+21.5)#17 | 46.1%(+18.0)#3,989 |
| 18. | 57432 | 64.0% | 42.6%(+21.4)#18 | 46.1%(+17.9)#4,020 |
| 19. | 57371 | 64.0% | 42.6%(+21.4)#19 | 46.1%(+17.9)#4,021 |
| 20. | 57005 | 63.9% | 42.6%(+21.3)#20 | 46.1%(+17.8)#4,038 |
| 21. | 57449 | 63.9% | 42.6%(+21.3)#21 | 46.1%(+17.8)#4,053 |
| 22. | 57386 | 63.4% | 42.6%(+20.8)#22 | 46.1%(+17.3)#4,183 |
| 23. | 57657 | 62.8% | 42.6%(+20.2)#23 | 46.1%(+16.7)#4,346 |
| 24. | 57015 | 61.7% | 42.6%(+19.1)#24 | 46.1%(+15.6)#4,652 |
| 25. | 57003 | 60.6% | 42.6%(+18.0)#25 | 46.1%(+14.5)#4,981 |
| 26. | 57379 | 60.0% | 42.6%(+17.4)#26 | 46.1%(+13.9)#5,148 |
| 27. | 57050 | 59.9% | 42.6%(+17.3)#27 | 46.1%(+13.8)#5,183 |
| 28. | 57108 | 59.5% | 42.6%(+16.9)#28 | 46.1%(+13.4)#5,290 |
| 29. | 57052 | 59.5% | 42.6%(+16.9)#29 | 46.1%(+13.4)#5,311 |
| 30. | 57075 | 59.3% | 42.6%(+16.7)#30 | 46.1%(+13.2)#5,364 |
| 31. | 57374 | 59.0% | 42.6%(+16.4)#31 | 46.1%(+12.9)#5,468 |
| 32. | 57532 | 58.8% | 42.6%(+16.2)#32 | 46.1%(+12.7)#5,522 |
| 33. | 57224 | 58.2% | 42.6%(+15.6)#33 | 46.1%(+12.1)#5,723 |
| 34. | 57427 | 57.9% | 42.6%(+15.3)#34 | 46.1%(+11.8)#5,825 |
| 35. | 57479 | 57.5% | 42.6%(+14.9)#35 | 46.1%(+11.4)#5,967 |
| 36. | 57016 | 57.1% | 42.6%(+14.5)#36 | 46.1%(+11.0)#6,081 |
| 37. | 57461 | 57.1% | 42.6%(+14.5)#37 | 46.1%(+11.0)#6,083 |
| 38. | 57237 | 57.0% | 42.6%(+14.4)#38 | 46.1%(+10.9)#6,126 |
| 39. | 57788 | 56.8% | 42.6%(+14.2)#39 | 46.1%(+10.7)#6,172 |
| 40. | 57055 | 56.6% | 42.6%(+14.0)#40 | 46.1%(+10.5)#6,237 |
| 41. | 57022 | 56.3% | 42.6%(+13.7)#41 | 46.1%(+10.2)#6,325 |
| 42. | 57646 | 56.2% | 42.6%(+13.6)#42 | 46.1%(+10.1)#6,386 |
| 43. | 57018 | 55.7% | 42.6%(+13.1)#43 | 46.1%(+9.60)#6,567 |
| 44. | 57481 | 55.6% | 42.6%(+13.0)#44 | 46.1%(+9.50)#6,613 |
| 45. | 57025 | 55.2% | 42.6%(+12.6)#45 | 46.1%(+9.10)#6,740 |
| 46. | 57035 | 55.0% | 42.6%(+12.4)#46 | 46.1%(+8.90)#6,813 |
| 47. | 57562 | 55.0% | 42.6%(+12.4)#47 | 46.1%(+8.90)#6,822 |
| 48. | 57012 | 54.6% | 42.6%(+12.0)#48 | 46.1%(+8.50)#6,957 |
| 49. | 57032 | 54.4% | 42.6%(+11.8)#49 | 46.1%(+8.30)#7,026 |
| 50. | 57049 | 54.4% | 42.6%(+11.8)#50 | 46.1%(+8.30)#7,027 |
| 51. | 57068 | 54.2% | 42.6%(+11.6)#51 | 46.1%(+8.10)#7,112 |
| 52. | 57038 | 53.9% | 42.6%(+11.3)#52 | 46.1%(+7.80)#7,216 |
| 53. | 57110 | 53.5% | 42.6%(+10.9)#53 | 46.1%(+7.40)#7,356 |
| 54. | 57359 | 53.3% | 42.6%(+10.7)#54 | 46.1%(+7.20)#7,444 |
| 55. | 57531 | 53.3% | 42.6%(+10.7)#55 | 46.1%(+7.20)#7,450 |
| 56. | 57769 | 53.1% | 42.6%(+10.5)#56 | 46.1%(+7.00)#7,510 |
| 57. | 57242 | 53.1% | 42.6%(+10.5)#57 | 46.1%(+7.00)#7,525 |
| 58. | 57367 | 53.0% | 42.6%(+10.4)#58 | 46.1%(+6.90)#7,573 |
| 59. | 57064 | 52.9% | 42.6%(+10.3)#59 | 46.1%(+6.80)#7,591 |
| 60. | 57702 | 52.5% | 42.6%(+9.90)#60 | 46.1%(+6.40)#7,746 |
| 61. | 57268 | 52.5% | 42.6%(+9.90)#61 | 46.1%(+6.40)#7,780 |
| 62. | 57744 | 52.4% | 42.6%(+9.80)#62 | 46.1%(+6.30)#7,818 |
| 63. | 57220 | 52.3% | 42.6%(+9.70)#63 | 46.1%(+6.20)#7,869 |
| 64. | 57017 | 52.2% | 42.6%(+9.60)#64 | 46.1%(+6.10)#7,902 |
| 65. | 57024 | 52.2% | 42.6%(+9.60)#65 | 46.1%(+6.10)#7,908 |
| 66. | 57381 | 52.2% | 42.6%(+9.60)#66 | 46.1%(+6.10)#7,910 |
| 67. | 57030 | 52.1% | 42.6%(+9.50)#67 | 46.1%(+6.00)#7,956 |
| 68. | 57564 | 52.1% | 42.6%(+9.50)#68 | 46.1%(+6.00)#7,964 |
| 69. | 57716 | 51.8% | 42.6%(+9.20)#69 | 46.1%(+5.70)#8,085 |
| 70. | 57010 | 51.7% | 42.6%(+9.10)#70 | 46.1%(+5.60)#8,129 |
| 71. | 57269 | 51.6% | 42.6%(+9.00)#71 | 46.1%(+5.50)#8,188 |
| 72. | 57536 | 51.3% | 42.6%(+8.70)#72 | 46.1%(+5.20)#8,312 |
| 73. | 57430 | 51.2% | 42.6%(+8.60)#73 | 46.1%(+5.10)#8,338 |
| 74. | 57033 | 51.0% | 42.6%(+8.40)#74 | 46.1%(+4.90)#8,417 |
| 75. | 57547 | 51.0% | 42.6%(+8.40)#75 | 46.1%(+4.90)#8,440 |
| 76. | 57311 | 50.9% | 42.6%(+8.30)#76 | 46.1%(+4.80)#8,471 |
| 77. | 57450 | 50.7% | 42.6%(+8.10)#77 | 46.1%(+4.60)#8,554 |
| 78. | 57435 | 50.7% | 42.6%(+8.10)#78 | 46.1%(+4.60)#8,558 |
| 79. | 57013 | 50.4% | 42.6%(+7.80)#79 | 46.1%(+4.30)#8,664 |
| 80. | 57006 | 50.3% | 42.6%(+7.70)#80 | 46.1%(+4.20)#8,690 |
| 81. | 57540 | 50.0% | 42.6%(+7.40)#81 | 46.1%(+3.90)#8,860 |
| 82. | 57027 | 50.0% | 42.6%(+7.40)#82 | 46.1%(+3.90)#8,864 |
| 83. | 57651 | 50.0% | 42.6%(+7.40)#83 | 46.1%(+3.90)#8,886 |
| 84. | 57054 | 49.6% | 42.6%(+7.00)#84 | 46.1%(+3.50)#9,038 |
| 85. | 57071 | 49.5% | 42.6%(+6.90)#85 | 46.1%(+3.40)#9,075 |
| 86. | 57761 | 49.4% | 42.6%(+6.80)#86 | 46.1%(+3.30)#9,126 |
| 87. | 57212 | 49.3% | 42.6%(+6.70)#87 | 46.1%(+3.20)#9,169 |
| 88. | 57779 | 49.3% | 42.6%(+6.70)#88 | 46.1%(+3.20)#9,183 |
| 89. | 57034 | 49.2% | 42.6%(+6.60)#89 | 46.1%(+3.10)#9,212 |
| 90. | 57751 | 49.1% | 42.6%(+6.50)#90 | 46.1%(+3.00)#9,245 |
| 91. | 57106 | 49.0% | 42.6%(+6.40)#91 | 46.1%(+2.90)#9,258 |
| 92. | 57256 | 49.0% | 42.6%(+6.40)#92 | 46.1%(+2.90)#9,296 |
| 93. | 57002 | 48.8% | 42.6%(+6.20)#93 | 46.1%(+2.70)#9,378 |
| 94. | 57324 | 48.8% | 42.6%(+6.20)#94 | 46.1%(+2.70)#9,387 |
| 95. | 57362 | 48.5% | 42.6%(+5.90)#95 | 46.1%(+2.40)#9,527 |
| 96. | 57648 | 48.5% | 42.6%(+5.90)#96 | 46.1%(+2.40)#9,542 |
| 97. | 57325 | 48.3% | 42.6%(+5.70)#97 | 46.1%(+2.20)#9,614 |
| 98. | 57053 | 47.9% | 42.6%(+5.30)#98 | 46.1%(+1.80)#9,824 |
| 99. | 57438 | 47.7% | 42.6%(+5.10)#99 | 46.1%(+1.60)#9,933 |
| 100. | 57783 | 47.6% | 42.6%(+5.00)#100 | 46.1%(+1.50)#9,961 |
Common Questions
What are the Top 10 Zip Codes with the Highest Percentage of Families with Income Above $100,000 in South Dakota?
Top 10 Zip Codes with the Highest Percentage of Families with Income Above $100,000 in South Dakota are:
What zip code has the Highest Percentage of Families with Income Above $100,000 in South Dakota?
57741 has the Highest Percentage of Families with Income Above $100,000 in South Dakota with 100.0%.
What is the Percentage of Families with Income Above $100,000 in the State of South Dakota?
Percentage of Families with Income Above $100,000 in South Dakota is 42.6%.
What is the Percentage of Families with Income Above $100,000 in the United States?
Percentage of Families with Income Above $100,000 in the United States is 46.1%.