Zip Codes with the Highest Percentage of Population with a Degree in Arts and Humanities in South Dakota
RELATED REPORTS & OPTIONS
Arts and Humanities
South Dakota
Compare Zip Codes
Map of Zip Codes with the Highest Percentage of Population with a Degree in Arts and Humanities in South Dakota
0.0%
80.0%
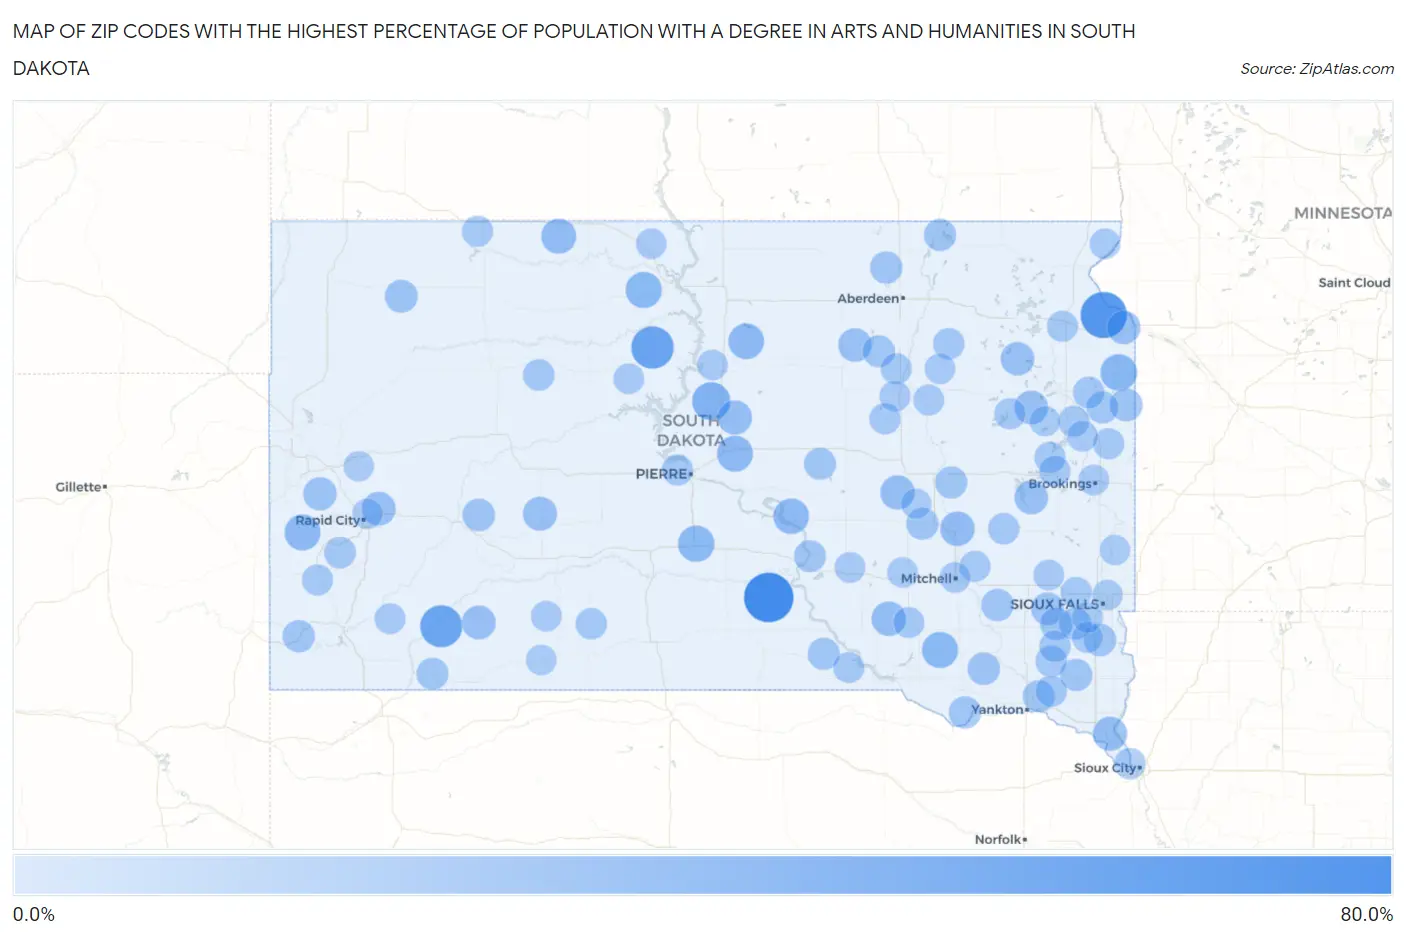
Zip Codes with the Highest Percentage of Population with a Degree in Arts and Humanities in South Dakota
| Zip Code | % Graduates | vs State | vs National | |
| 1. | 57534 | 75.0% | 7.1% (+67.9)#1 | 6.0% (+69.0)#108 |
| 2. | 57227 | 63.3% | 7.1% (+56.3)#2 | 6.0% (+57.3)#148 |
| 3. | 57652 | 50.0% | 7.1% (+42.9)#3 | 6.0% (+44.0)#211 |
| 4. | 57772 | 48.7% | 7.1% (+41.7)#4 | 6.0% (+42.7)#245 |
| 5. | 57520 | 34.8% | 7.1% (+27.7)#5 | 6.0% (+28.8)#479 |
| 6. | 57259 | 29.5% | 7.1% (+22.4)#6 | 6.0% (+23.5)#683 |
| 7. | 57576 | 28.6% | 7.1% (+21.5)#7 | 6.0% (+22.6)#737 |
| 8. | 57657 | 28.0% | 7.1% (+20.9)#8 | 6.0% (+22.0)#760 |
| 9. | 57330 | 27.9% | 7.1% (+20.9)#9 | 6.0% (+21.9)#765 |
| 10. | 57522 | 27.1% | 7.1% (+20.0)#10 | 6.0% (+21.1)#817 |
| 11. | 57745 | 26.9% | 7.1% (+19.9)#11 | 6.0% (+20.9)#827 |
| 12. | 57450 | 26.4% | 7.1% (+19.4)#12 | 6.0% (+20.4)#861 |
| 13. | 57339 | 25.7% | 7.1% (+18.7)#13 | 6.0% (+19.7)#908 |
| 14. | 57660 | 23.8% | 7.1% (+16.8)#14 | 6.0% (+17.8)#1,049 |
| 15. | 57314 | 22.4% | 7.1% (+15.4)#15 | 6.0% (+16.4)#1,175 |
| 16. | 57344 | 22.2% | 7.1% (+15.2)#16 | 6.0% (+16.2)#1,206 |
| 17. | 57379 | 22.0% | 7.1% (+14.9)#17 | 6.0% (+16.0)#1,243 |
| 18. | 57564 | 21.2% | 7.1% (+14.2)#18 | 6.0% (+15.2)#1,328 |
| 19. | 57025 | 21.1% | 7.1% (+14.1)#19 | 6.0% (+15.1)#1,338 |
| 20. | 57567 | 20.7% | 7.1% (+13.6)#20 | 6.0% (+14.7)#1,387 |
| 21. | 57752 | 20.0% | 7.1% (+12.9)#21 | 6.0% (+14.0)#1,472 |
| 22. | 57706 | 19.9% | 7.1% (+12.8)#22 | 6.0% (+13.9)#1,514 |
| 23. | 57242 | 19.8% | 7.1% (+12.7)#23 | 6.0% (+13.8)#1,534 |
| 24. | 57051 | 19.3% | 7.1% (+12.2)#24 | 6.0% (+13.3)#1,611 |
| 25. | 57435 | 19.2% | 7.1% (+12.2)#25 | 6.0% (+13.2)#1,619 |
| 26. | 57272 | 19.0% | 7.1% (+12.0)#26 | 6.0% (+13.1)#1,647 |
| 27. | 57216 | 18.8% | 7.1% (+11.7)#27 | 6.0% (+12.8)#1,686 |
| 28. | 57732 | 18.3% | 7.1% (+11.3)#28 | 6.0% (+12.3)#1,773 |
| 29. | 57649 | 17.2% | 7.1% (+10.2)#29 | 6.0% (+11.2)#2,027 |
| 30. | 57237 | 16.5% | 7.1% (+9.48)#30 | 6.0% (+10.5)#2,210 |
| 31. | 57047 | 16.1% | 7.1% (+9.07)#31 | 6.0% (+10.1)#2,312 |
| 32. | 57790 | 16.0% | 7.1% (+8.98)#32 | 6.0% (+10.0)#2,334 |
| 33. | 57059 | 15.8% | 7.1% (+8.75)#33 | 6.0% (+9.81)#2,392 |
| 34. | 57332 | 15.3% | 7.1% (+8.26)#34 | 6.0% (+9.33)#2,554 |
| 35. | 57077 | 15.3% | 7.1% (+8.25)#35 | 6.0% (+9.32)#2,558 |
| 36. | 57053 | 15.2% | 7.1% (+8.15)#36 | 6.0% (+9.22)#2,593 |
| 37. | 57735 | 15.0% | 7.1% (+7.94)#37 | 6.0% (+9.00)#2,667 |
| 38. | 57062 | 15.0% | 7.1% (+7.91)#38 | 6.0% (+8.97)#2,689 |
| 39. | 57481 | 14.8% | 7.1% (+7.71)#39 | 6.0% (+8.78)#2,774 |
| 40. | 57014 | 14.6% | 7.1% (+7.51)#40 | 6.0% (+8.58)#2,846 |
| 41. | 57015 | 14.4% | 7.1% (+7.32)#41 | 6.0% (+8.39)#2,935 |
| 42. | 57446 | 14.3% | 7.1% (+7.23)#42 | 6.0% (+8.29)#2,976 |
| 43. | 57324 | 14.3% | 7.1% (+7.23)#43 | 6.0% (+8.29)#2,980 |
| 44. | 57523 | 14.2% | 7.1% (+7.13)#44 | 6.0% (+8.19)#3,037 |
| 45. | 57385 | 14.1% | 7.1% (+7.04)#45 | 6.0% (+8.11)#3,072 |
| 46. | 57465 | 14.0% | 7.1% (+6.98)#46 | 6.0% (+8.04)#3,116 |
| 47. | 57046 | 13.8% | 7.1% (+6.77)#47 | 6.0% (+7.83)#3,210 |
| 48. | 57371 | 13.8% | 7.1% (+6.73)#48 | 6.0% (+7.80)#3,230 |
| 49. | 57770 | 13.8% | 7.1% (+6.72)#49 | 6.0% (+7.78)#3,236 |
| 50. | 57226 | 13.7% | 7.1% (+6.64)#50 | 6.0% (+7.70)#3,262 |
| 51. | 57325 | 13.3% | 7.1% (+6.23)#51 | 6.0% (+7.29)#3,478 |
| 52. | 57751 | 12.9% | 7.1% (+5.87)#52 | 6.0% (+6.94)#3,690 |
| 53. | 57238 | 12.8% | 7.1% (+5.76)#53 | 6.0% (+6.82)#3,758 |
| 54. | 57623 | 12.6% | 7.1% (+5.56)#54 | 6.0% (+6.63)#3,879 |
| 55. | 57070 | 12.1% | 7.1% (+5.02)#55 | 6.0% (+6.08)#4,263 |
| 56. | 57560 | 12.0% | 7.1% (+4.94)#56 | 6.0% (+6.00)#4,313 |
| 57. | 57349 | 12.0% | 7.1% (+4.91)#57 | 6.0% (+5.98)#4,327 |
| 58. | 57434 | 11.9% | 7.1% (+4.88)#58 | 6.0% (+5.94)#4,351 |
| 59. | 57072 | 11.8% | 7.1% (+4.76)#59 | 6.0% (+5.82)#4,438 |
| 60. | 57036 | 11.8% | 7.1% (+4.71)#60 | 6.0% (+5.77)#4,490 |
| 61. | 57049 | 11.7% | 7.1% (+4.61)#61 | 6.0% (+5.67)#4,559 |
| 62. | 57033 | 11.4% | 7.1% (+4.37)#62 | 6.0% (+5.43)#4,750 |
| 63. | 57476 | 11.1% | 7.1% (+4.05)#63 | 6.0% (+5.12)#5,044 |
| 64. | 57271 | 11.1% | 7.1% (+4.05)#64 | 6.0% (+5.12)#5,055 |
| 65. | 57214 | 11.1% | 7.1% (+4.05)#65 | 6.0% (+5.12)#5,061 |
| 66. | 57212 | 11.0% | 7.1% (+3.98)#66 | 6.0% (+5.04)#5,113 |
| 67. | 57638 | 11.0% | 7.1% (+3.90)#67 | 6.0% (+4.97)#5,163 |
| 68. | 57268 | 10.8% | 7.1% (+3.75)#68 | 6.0% (+4.82)#5,307 |
| 69. | 57424 | 10.8% | 7.1% (+3.75)#69 | 6.0% (+4.82)#5,308 |
| 70. | 57532 | 10.8% | 7.1% (+3.72)#70 | 6.0% (+4.79)#5,326 |
| 71. | 57223 | 10.7% | 7.1% (+3.69)#71 | 6.0% (+4.75)#5,370 |
| 72. | 57340 | 10.7% | 7.1% (+3.65)#72 | 6.0% (+4.72)#5,410 |
| 73. | 57317 | 10.6% | 7.1% (+3.53)#73 | 6.0% (+4.59)#5,551 |
| 74. | 57730 | 10.6% | 7.1% (+3.51)#74 | 6.0% (+4.57)#5,570 |
| 75. | 57328 | 10.6% | 7.1% (+3.50)#75 | 6.0% (+4.56)#5,579 |
| 76. | 57266 | 10.4% | 7.1% (+3.36)#76 | 6.0% (+4.42)#5,729 |
| 77. | 57469 | 10.2% | 7.1% (+3.13)#77 | 6.0% (+4.19)#5,999 |
| 78. | 57234 | 10.1% | 7.1% (+3.07)#78 | 6.0% (+4.13)#6,084 |
| 79. | 57039 | 10.1% | 7.1% (+3.00)#79 | 6.0% (+4.06)#6,164 |
| 80. | 57440 | 10.0% | 7.1% (+2.94)#80 | 6.0% (+4.00)#6,251 |
| 81. | 57722 | 10.0% | 7.1% (+2.94)#81 | 6.0% (+4.00)#6,267 |
| 82. | 57355 | 9.9% | 7.1% (+2.88)#82 | 6.0% (+3.95)#6,332 |
| 83. | 57048 | 9.7% | 7.1% (+2.68)#83 | 6.0% (+3.74)#6,600 |
| 84. | 57625 | 9.6% | 7.1% (+2.53)#84 | 6.0% (+3.59)#6,801 |
| 85. | 57006 | 9.6% | 7.1% (+2.51)#85 | 6.0% (+3.57)#6,833 |
| 86. | 57368 | 9.5% | 7.1% (+2.46)#86 | 6.0% (+3.53)#6,895 |
| 87. | 57577 | 9.5% | 7.1% (+2.43)#87 | 6.0% (+3.49)#6,948 |
| 88. | 57442 | 9.4% | 7.1% (+2.29)#88 | 6.0% (+3.36)#7,167 |
| 89. | 57301 | 9.2% | 7.1% (+2.15)#89 | 6.0% (+3.21)#7,403 |
| 90. | 57064 | 9.2% | 7.1% (+2.13)#90 | 6.0% (+3.19)#7,435 |
| 91. | 57260 | 9.2% | 7.1% (+2.10)#91 | 6.0% (+3.16)#7,474 |
| 92. | 57477 | 9.1% | 7.1% (+2.03)#92 | 6.0% (+3.10)#7,611 |
| 93. | 57642 | 9.0% | 7.1% (+1.95)#93 | 6.0% (+3.01)#7,732 |
| 94. | 57551 | 8.6% | 7.1% (+1.54)#94 | 6.0% (+2.60)#8,449 |
| 95. | 57701 | 8.6% | 7.1% (+1.52)#95 | 6.0% (+2.58)#8,481 |
| 96. | 57104 | 8.4% | 7.1% (+1.36)#96 | 6.0% (+2.42)#8,779 |
| 97. | 57241 | 8.4% | 7.1% (+1.34)#97 | 6.0% (+2.41)#8,808 |
| 98. | 57785 | 8.4% | 7.1% (+1.33)#98 | 6.0% (+2.40)#8,826 |
| 99. | 57312 | 8.3% | 7.1% (+1.27)#99 | 6.0% (+2.34)#8,951 |
| 100. | 57065 | 8.3% | 7.1% (+1.27)#100 | 6.0% (+2.34)#8,963 |
Common Questions
What are the Top 10 Zip Codes with the Highest Percentage of Population with a Degree in Arts and Humanities in South Dakota?
Top 10 Zip Codes with the Highest Percentage of Population with a Degree in Arts and Humanities in South Dakota are:
What zip code has the Highest Percentage of Population with a Degree in Arts and Humanities in South Dakota?
57534 has the Highest Percentage of Population with a Degree in Arts and Humanities in South Dakota with 75.0%.
What is the Percentage of Population with a Degree in Arts and Humanities in the State of South Dakota?
Percentage of Population with a Degree in Arts and Humanities in South Dakota is 7.1%.
What is the Percentage of Population with a Degree in Arts and Humanities in the United States?
Percentage of Population with a Degree in Arts and Humanities in the United States is 6.0%.