Zip Codes with the Lowest Renter-Occupied Median Costs of Housing in South Dakota
RELATED REPORTS & OPTIONS
Lowest Renter Housing Costs
South Dakota
Compare Zip Codes
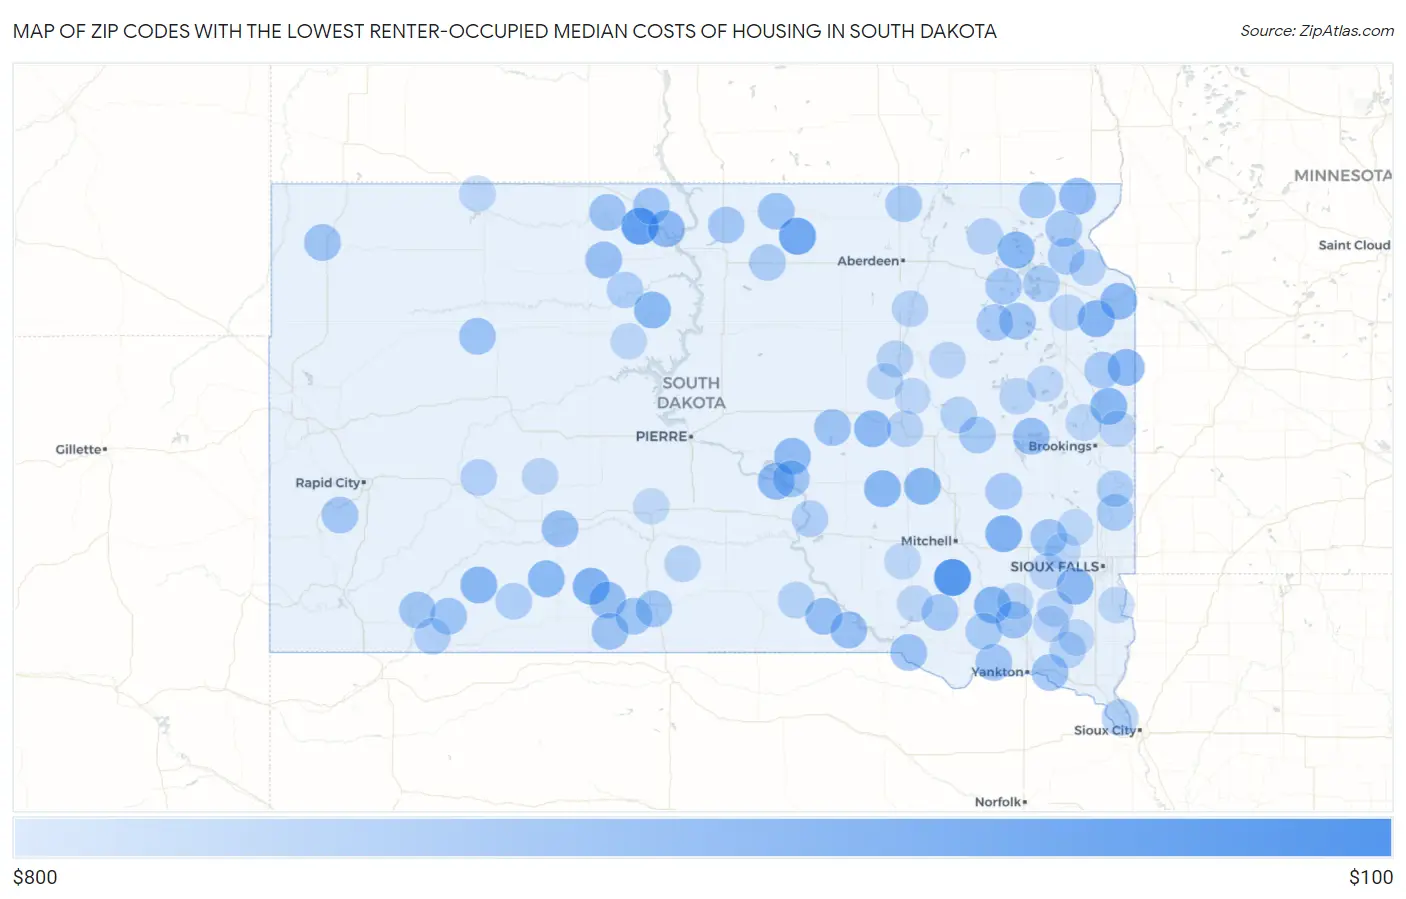
Map of Zip Codes with the Lowest Renter-Occupied Median Costs of Housing in South Dakota
$800
$100
Zip Codes with the Lowest Renter-Occupied Median Costs of Housing in South Dakota
| Zip Code | Housing Costs | vs State | vs National | |
| 1. | 57331 | $179 | $878(-699)#1 | $1,268(-1.09k)#2 |
| 2. | 57639 | $244 | $878(-634)#2 | $1,268(-1.02k)#15 |
| 3. | 57448 | $300 | $878(-578)#3 | $1,268(-968)#32 |
| 4. | 57560 | $400 | $878(-478)#4 | $1,268(-868)#171 |
| 5. | 57374 | $400 | $878(-478)#5 | $1,268(-868)#173 |
| 6. | 57264 | $413 | $878(-465)#6 | $1,268(-855)#199 |
| 7. | 57385 | $425 | $878(-453)#7 | $1,268(-843)#226 |
| 8. | 57268 | $425 | $878(-453)#8 | $1,268(-843)#229 |
| 9. | 57052 | $425 | $878(-453)#9 | $1,268(-843)#232 |
| 10. | 57752 | $426 | $878(-452)#10 | $1,268(-842)#236 |
| 11. | 57382 | $431 | $878(-447)#11 | $1,268(-837)#245 |
| 12. | 57261 | $433 | $878(-445)#12 | $1,268(-835)#255 |
| 13. | 57577 | $434 | $878(-444)#13 | $1,268(-834)#258 |
| 14. | 57652 | $441 | $878(-437)#14 | $1,268(-827)#294 |
| 15. | 57015 | $446 | $878(-432)#15 | $1,268(-822)#312 |
| 16. | 57237 | $446 | $878(-432)#16 | $1,268(-822)#313 |
| 17. | 57381 | $450 | $878(-428)#17 | $1,268(-818)#326 |
| 18. | 57658 | $450 | $878(-428)#18 | $1,268(-818)#327 |
| 19. | 57548 | $457 | $878(-421)#19 | $1,268(-811)#345 |
| 20. | 57252 | $462 | $878(-416)#20 | $1,268(-806)#360 |
| 21. | 57346 | $467 | $878(-411)#21 | $1,268(-801)#380 |
| 22. | 57255 | $475 | $878(-403)#22 | $1,268(-793)#420 |
| 23. | 57566 | $486 | $878(-392)#23 | $1,268(-782)#488 |
| 24. | 57543 | $496 | $878(-382)#24 | $1,268(-772)#583 |
| 25. | 57523 | $498 | $878(-380)#25 | $1,268(-770)#602 |
| 26. | 57249 | $499 | $878(-379)#26 | $1,268(-769)#611 |
| 27. | 57656 | $500 | $878(-378)#27 | $1,268(-768)#620 |
| 28. | 57317 | $514 | $878(-364)#28 | $1,268(-754)#680 |
| 29. | 57361 | $520 | $878(-358)#29 | $1,268(-748)#724 |
| 30. | 57437 | $521 | $878(-357)#30 | $1,268(-747)#726 |
| 31. | 57031 | $521 | $878(-357)#31 | $1,268(-747)#729 |
| 32. | 57626 | $523 | $878(-355)#32 | $1,268(-745)#739 |
| 33. | 57362 | $527 | $878(-351)#33 | $1,268(-741)#789 |
| 34. | 57045 | $528 | $878(-350)#34 | $1,268(-740)#796 |
| 35. | 57272 | $528 | $878(-350)#35 | $1,268(-740)#798 |
| 36. | 57621 | $529 | $878(-349)#36 | $1,268(-739)#809 |
| 37. | 57572 | $532 | $878(-346)#37 | $1,268(-736)#837 |
| 38. | 57720 | $533 | $878(-345)#38 | $1,268(-735)#848 |
| 39. | 57756 | $539 | $878(-339)#39 | $1,268(-729)#926 |
| 40. | 57570 | $540 | $878(-338)#40 | $1,268(-728)#934 |
| 41. | 57339 | $542 | $878(-336)#41 | $1,268(-726)#952 |
| 42. | 57063 | $547 | $878(-331)#42 | $1,268(-721)#1,025 |
| 43. | 57764 | $555 | $878(-323)#43 | $1,268(-713)#1,088 |
| 44. | 57048 | $556 | $878(-322)#44 | $1,268(-712)#1,097 |
| 45. | 57555 | $557 | $878(-321)#45 | $1,268(-711)#1,103 |
| 46. | 57646 | $558 | $878(-320)#46 | $1,268(-710)#1,115 |
| 47. | 57751 | $561 | $878(-317)#47 | $1,268(-707)#1,142 |
| 48. | 57642 | $563 | $878(-315)#48 | $1,268(-705)#1,151 |
| 49. | 57274 | $565 | $878(-313)#49 | $1,268(-703)#1,192 |
| 50. | 57353 | $575 | $878(-303)#50 | $1,268(-693)#1,324 |
| 51. | 57270 | $577 | $878(-301)#51 | $1,268(-691)#1,377 |
| 52. | 57330 | $578 | $878(-300)#52 | $1,268(-690)#1,396 |
| 53. | 57217 | $580 | $878(-298)#53 | $1,268(-688)#1,417 |
| 54. | 57257 | $581 | $878(-297)#54 | $1,268(-687)#1,427 |
| 55. | 57262 | $584 | $878(-294)#55 | $1,268(-684)#1,470 |
| 56. | 57226 | $585 | $878(-293)#56 | $1,268(-683)#1,499 |
| 57. | 57349 | $588 | $878(-290)#57 | $1,268(-680)#1,544 |
| 58. | 57059 | $589 | $878(-289)#58 | $1,268(-679)#1,569 |
| 59. | 57273 | $589 | $878(-289)#59 | $1,268(-679)#1,570 |
| 60. | 57441 | $594 | $878(-284)#60 | $1,268(-674)#1,649 |
| 61. | 57065 | $599 | $878(-279)#61 | $1,268(-669)#1,728 |
| 62. | 57428 | $609 | $878(-269)#62 | $1,268(-659)#1,865 |
| 63. | 57028 | $613 | $878(-265)#63 | $1,268(-655)#1,908 |
| 64. | 57038 | $613 | $878(-265)#64 | $1,268(-655)#1,919 |
| 65. | 57661 | $613 | $878(-265)#65 | $1,268(-655)#1,934 |
| 66. | 57714 | $617 | $878(-261)#66 | $1,268(-651)#1,990 |
| 67. | 57325 | $622 | $878(-256)#67 | $1,268(-646)#2,086 |
| 68. | 57770 | $623 | $878(-255)#68 | $1,268(-645)#2,099 |
| 69. | 57790 | $625 | $878(-253)#69 | $1,268(-643)#2,144 |
| 70. | 57533 | $640 | $878(-238)#70 | $1,268(-628)#2,512 |
| 71. | 57386 | $640 | $878(-238)#71 | $1,268(-628)#2,527 |
| 72. | 57279 | $641 | $878(-237)#72 | $1,268(-627)#2,543 |
| 73. | 57073 | $642 | $878(-236)#73 | $1,268(-626)#2,569 |
| 74. | 57384 | $644 | $878(-234)#74 | $1,268(-624)#2,624 |
| 75. | 57461 | $644 | $878(-234)#75 | $1,268(-624)#2,631 |
| 76. | 57469 | $646 | $878(-232)#76 | $1,268(-622)#2,666 |
| 77. | 57454 | $650 | $878(-228)#77 | $1,268(-618)#2,766 |
| 78. | 57585 | $655 | $878(-223)#78 | $1,268(-613)#2,851 |
| 79. | 57221 | $660 | $878(-218)#79 | $1,268(-608)#2,951 |
| 80. | 57036 | $663 | $878(-215)#80 | $1,268(-605)#3,014 |
| 81. | 57263 | $664 | $878(-214)#81 | $1,268(-604)#3,053 |
| 82. | 57047 | $665 | $878(-213)#82 | $1,268(-603)#3,069 |
| 83. | 57070 | $667 | $878(-211)#83 | $1,268(-601)#3,111 |
| 84. | 57276 | $669 | $878(-209)#84 | $1,268(-599)#3,166 |
| 85. | 57567 | $670 | $878(-208)#85 | $1,268(-598)#3,199 |
| 86. | 57436 | $670 | $878(-208)#86 | $1,268(-598)#3,203 |
| 87. | 57220 | $675 | $878(-203)#87 | $1,268(-593)#3,347 |
| 88. | 57035 | $679 | $878(-199)#88 | $1,268(-589)#3,469 |
| 89. | 57013 | $680 | $878(-198)#89 | $1,268(-588)#3,487 |
| 90. | 57029 | $680 | $878(-198)#90 | $1,268(-588)#3,495 |
| 91. | 57018 | $680 | $878(-198)#91 | $1,268(-588)#3,502 |
| 92. | 57313 | $681 | $878(-197)#92 | $1,268(-587)#3,539 |
| 93. | 57638 | $682 | $878(-196)#93 | $1,268(-586)#3,569 |
| 94. | 57476 | $682 | $878(-196)#94 | $1,268(-586)#3,581 |
| 95. | 57375 | $684 | $878(-194)#95 | $1,268(-584)#3,639 |
| 96. | 57625 | $689 | $878(-189)#96 | $1,268(-579)#3,784 |
| 97. | 57348 | $690 | $878(-188)#97 | $1,268(-578)#3,822 |
| 98. | 57014 | $691 | $878(-187)#98 | $1,268(-577)#3,850 |
| 99. | 57241 | $692 | $878(-186)#99 | $1,268(-576)#3,884 |
| 100. | 57559 | $698 | $878(-180)#100 | $1,268(-570)#4,082 |
Common Questions
What are the Top 10 Zip Codes with the Lowest Renter-Occupied Median Costs of Housing in South Dakota?
Top 10 Zip Codes with the Lowest Renter-Occupied Median Costs of Housing in South Dakota are:
What zip code has the Lowest Renter-Occupied Median Costs of Housing in South Dakota?
57331 has the Lowest Renter-Occupied Median Costs of Housing in South Dakota with $179.
What is the Median Renter-Occupied Housing Costs in the State of South Dakota?
Median Renter-Occupied Housing Costs in South Dakota is $878.
What is the Median Renter-Occupied Housing Costs in the United States?
Median Renter-Occupied Housing Costs in the United States is $1,268.