Zip Codes with the Highest Percentage of Households Heated by Bottled Gas / Liquid Propane in South Dakota
RELATED REPORTS & OPTIONS
Bottled Gas / LP Heating
South Dakota
Compare Zip Codes
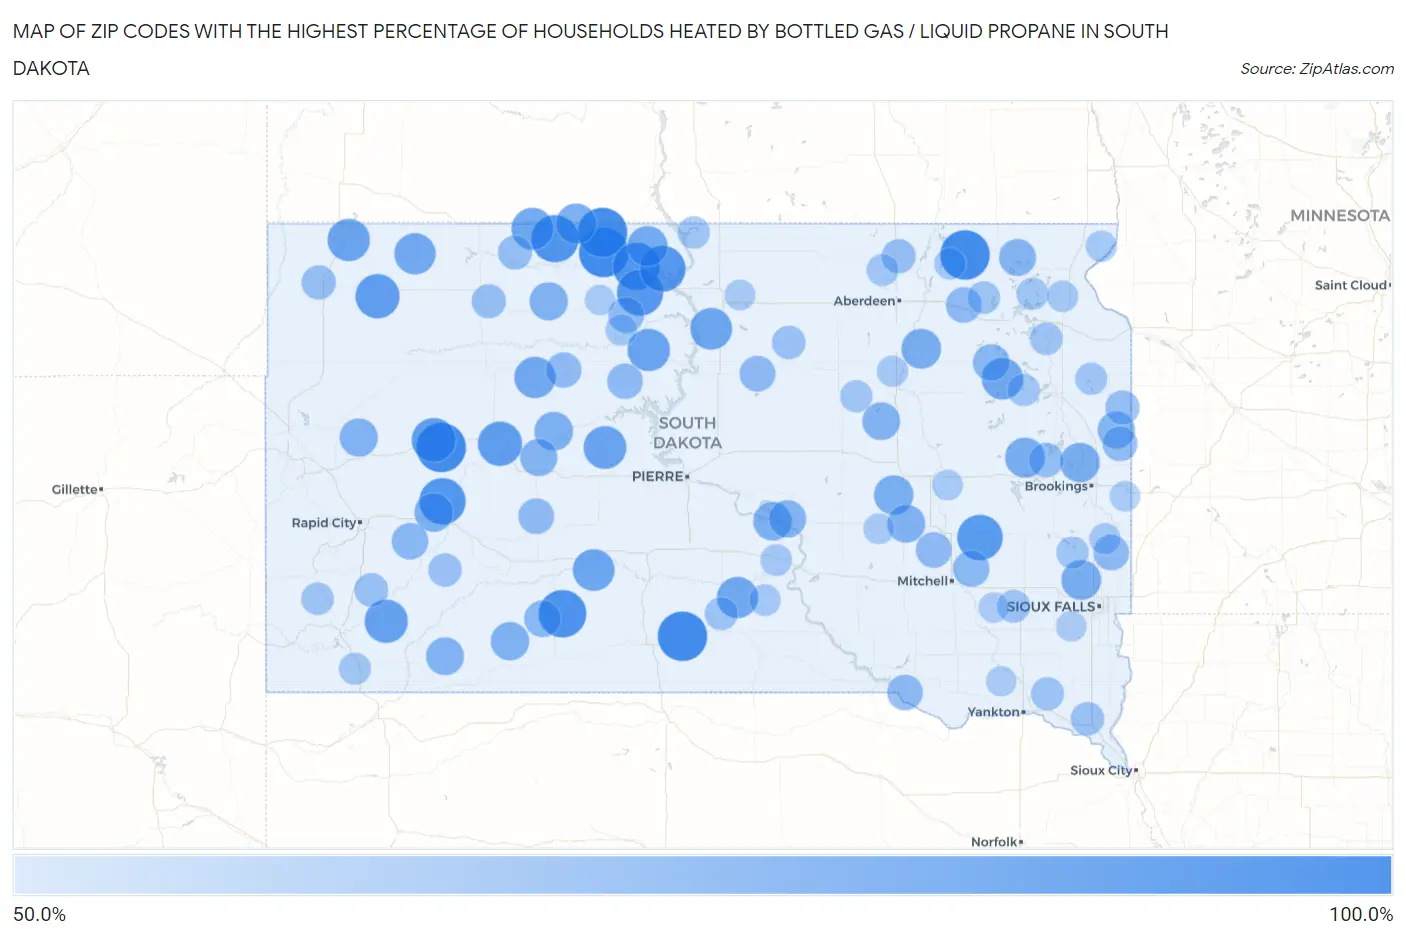
Map of Zip Codes with the Highest Percentage of Households Heated by Bottled Gas / Liquid Propane in South Dakota
50.0%
100.0%
Zip Codes with the Highest Percentage of Households Heated by Bottled Gas / Liquid Propane in South Dakota
| Zip Code | Bottled Gas / LP Heating | vs State | vs National | |
| 1. | 57621 | 100.0% | 15.7%(+84.3)#1 | 4.9%(+95.1)#8 |
| 2. | 57563 | 100.0% | 15.7%(+84.3)#2 | 4.9%(+95.1)#52 |
| 3. | 57421 | 100.0% | 15.7%(+84.3)#3 | 4.9%(+95.1)#58 |
| 4. | 57737 | 100.0% | 15.7%(+84.3)#4 | 4.9%(+95.1)#63 |
| 5. | 57659 | 100.0% | 15.7%(+84.3)#5 | 4.9%(+95.1)#119 |
| 6. | 57547 | 95.9% | 15.7%(+80.2)#6 | 4.9%(+91.0)#144 |
| 7. | 57660 | 95.1% | 15.7%(+79.4)#7 | 4.9%(+90.2)#146 |
| 8. | 57639 | 94.6% | 15.7%(+78.9)#8 | 4.9%(+89.7)#148 |
| 9. | 57791 | 93.1% | 15.7%(+77.4)#9 | 4.9%(+88.2)#160 |
| 10. | 57657 | 92.9% | 15.7%(+77.2)#10 | 4.9%(+88.0)#165 |
| 11. | 57658 | 92.4% | 15.7%(+76.7)#11 | 4.9%(+87.5)#168 |
| 12. | 57337 | 91.2% | 15.7%(+75.5)#12 | 4.9%(+86.3)#179 |
| 13. | 57748 | 88.6% | 15.7%(+72.9)#13 | 4.9%(+83.7)#209 |
| 14. | 57651 | 88.5% | 15.7%(+72.8)#14 | 4.9%(+83.6)#213 |
| 15. | 57787 | 88.2% | 15.7%(+72.5)#15 | 4.9%(+83.3)#216 |
| 16. | 57722 | 86.3% | 15.7%(+70.6)#16 | 4.9%(+81.4)#242 |
| 17. | 57537 | 85.3% | 15.7%(+69.6)#17 | 4.9%(+80.4)#265 |
| 18. | 57652 | 84.6% | 15.7%(+68.9)#18 | 4.9%(+79.7)#272 |
| 19. | 57755 | 84.4% | 15.7%(+68.7)#19 | 4.9%(+79.5)#279 |
| 20. | 57645 | 83.6% | 15.7%(+67.9)#20 | 4.9%(+78.7)#303 |
| 21. | 57521 | 83.1% | 15.7%(+67.4)#21 | 4.9%(+78.2)#313 |
| 22. | 57420 | 83.1% | 15.7%(+67.4)#22 | 4.9%(+78.2)#314 |
| 23. | 57236 | 82.5% | 15.7%(+66.8)#23 | 4.9%(+77.6)#326 |
| 24. | 57623 | 82.2% | 15.7%(+66.5)#24 | 4.9%(+77.3)#335 |
| 25. | 57541 | 82.1% | 15.7%(+66.4)#25 | 4.9%(+77.2)#339 |
| 26. | 57640 | 82.1% | 15.7%(+66.4)#26 | 4.9%(+77.2)#342 |
| 27. | 57641 | 80.2% | 15.7%(+64.5)#27 | 4.9%(+75.3)#383 |
| 28. | 57642 | 80.1% | 15.7%(+64.4)#28 | 4.9%(+75.2)#384 |
| 29. | 57233 | 78.8% | 15.7%(+63.1)#29 | 4.9%(+73.9)#420 |
| 30. | 57041 | 78.7% | 15.7%(+63.0)#30 | 4.9%(+73.8)#423 |
| 31. | 57429 | 78.7% | 15.7%(+63.0)#31 | 4.9%(+73.8)#424 |
| 32. | 57220 | 78.4% | 15.7%(+62.7)#32 | 4.9%(+73.5)#430 |
| 33. | 57379 | 78.1% | 15.7%(+62.4)#33 | 4.9%(+73.2)#441 |
| 34. | 57767 | 76.5% | 15.7%(+60.8)#34 | 4.9%(+71.6)#486 |
| 35. | 57548 | 76.3% | 15.7%(+60.6)#35 | 4.9%(+71.4)#491 |
| 36. | 57622 | 76.3% | 15.7%(+60.6)#36 | 4.9%(+71.4)#493 |
| 37. | 57714 | 75.8% | 15.7%(+60.1)#37 | 4.9%(+70.9)#512 |
| 38. | 57633 | 75.6% | 15.7%(+59.9)#38 | 4.9%(+70.7)#519 |
| 39. | 57788 | 75.2% | 15.7%(+59.5)#39 | 4.9%(+70.3)#535 |
| 40. | 57358 | 75.0% | 15.7%(+59.3)#40 | 4.9%(+70.1)#553 |
| 41. | 57756 | 74.8% | 15.7%(+59.1)#41 | 4.9%(+69.9)#555 |
| 42. | 57476 | 74.7% | 15.7%(+59.0)#42 | 4.9%(+69.8)#557 |
| 43. | 57339 | 73.5% | 15.7%(+57.8)#43 | 4.9%(+68.6)#597 |
| 44. | 57553 | 73.3% | 15.7%(+57.6)#44 | 4.9%(+68.4)#607 |
| 45. | 57218 | 73.2% | 15.7%(+57.5)#45 | 4.9%(+68.3)#611 |
| 46. | 57247 | 73.0% | 15.7%(+57.3)#46 | 4.9%(+68.1)#629 |
| 47. | 57217 | 72.3% | 15.7%(+56.6)#47 | 4.9%(+67.4)#650 |
| 48. | 57577 | 72.1% | 15.7%(+56.4)#48 | 4.9%(+67.2)#653 |
| 49. | 57725 | 71.9% | 15.7%(+56.2)#49 | 4.9%(+67.0)#663 |
| 50. | 57340 | 71.3% | 15.7%(+55.6)#50 | 4.9%(+66.4)#682 |
| 51. | 57455 | 70.4% | 15.7%(+54.7)#51 | 4.9%(+65.5)#711 |
| 52. | 57359 | 70.3% | 15.7%(+54.6)#52 | 4.9%(+65.4)#714 |
| 53. | 57567 | 70.2% | 15.7%(+54.5)#53 | 4.9%(+65.3)#721 |
| 54. | 57361 | 70.0% | 15.7%(+54.3)#54 | 4.9%(+65.1)#732 |
| 55. | 57422 | 70.0% | 15.7%(+54.3)#55 | 4.9%(+65.1)#734 |
| 56. | 57630 | 70.0% | 15.7%(+54.3)#56 | 4.9%(+65.1)#735 |
| 57. | 57065 | 69.9% | 15.7%(+54.2)#57 | 4.9%(+65.0)#737 |
| 58. | 57625 | 69.8% | 15.7%(+54.1)#58 | 4.9%(+64.9)#739 |
| 59. | 57636 | 69.4% | 15.7%(+53.7)#59 | 4.9%(+64.5)#764 |
| 60. | 57213 | 68.2% | 15.7%(+52.5)#60 | 4.9%(+63.3)#817 |
| 61. | 57214 | 67.3% | 15.7%(+51.6)#61 | 4.9%(+62.4)#872 |
| 62. | 57720 | 67.1% | 15.7%(+51.4)#62 | 4.9%(+62.2)#882 |
| 63. | 57644 | 66.9% | 15.7%(+51.2)#63 | 4.9%(+62.0)#897 |
| 64. | 57237 | 66.8% | 15.7%(+51.1)#64 | 4.9%(+61.9)#900 |
| 65. | 57634 | 66.7% | 15.7%(+51.0)#65 | 4.9%(+61.8)#919 |
| 66. | 57426 | 66.7% | 15.7%(+51.0)#66 | 4.9%(+61.8)#924 |
| 67. | 57738 | 65.9% | 15.7%(+50.2)#67 | 4.9%(+61.0)#968 |
| 68. | 57466 | 65.4% | 15.7%(+49.7)#68 | 4.9%(+60.5)#1,000 |
| 69. | 57780 | 65.3% | 15.7%(+49.6)#69 | 4.9%(+60.4)#1,007 |
| 70. | 57010 | 65.0% | 15.7%(+49.3)#70 | 4.9%(+60.1)#1,018 |
| 71. | 57072 | 64.6% | 15.7%(+48.9)#71 | 4.9%(+59.7)#1,040 |
| 72. | 57584 | 64.3% | 15.7%(+48.6)#72 | 4.9%(+59.4)#1,061 |
| 73. | 57319 | 64.0% | 15.7%(+48.3)#73 | 4.9%(+59.1)#1,087 |
| 74. | 57468 | 63.5% | 15.7%(+47.8)#74 | 4.9%(+58.6)#1,128 |
| 75. | 57256 | 63.5% | 15.7%(+47.8)#75 | 4.9%(+58.6)#1,129 |
| 76. | 57773 | 63.3% | 15.7%(+47.6)#76 | 4.9%(+58.4)#1,138 |
| 77. | 57648 | 63.1% | 15.7%(+47.4)#77 | 4.9%(+58.2)#1,148 |
| 78. | 57016 | 62.9% | 15.7%(+47.2)#78 | 4.9%(+58.0)#1,159 |
| 79. | 57470 | 62.9% | 15.7%(+47.2)#79 | 4.9%(+58.0)#1,162 |
| 80. | 57243 | 62.8% | 15.7%(+47.1)#80 | 4.9%(+57.9)#1,167 |
| 81. | 57265 | 62.5% | 15.7%(+46.8)#81 | 4.9%(+57.6)#1,187 |
| 82. | 57239 | 62.4% | 15.7%(+46.7)#82 | 4.9%(+57.5)#1,196 |
| 83. | 57763 | 62.4% | 15.7%(+46.7)#83 | 4.9%(+57.5)#1,197 |
| 84. | 57481 | 62.0% | 15.7%(+46.3)#84 | 4.9%(+57.1)#1,224 |
| 85. | 57569 | 61.3% | 15.7%(+45.6)#85 | 4.9%(+56.4)#1,275 |
| 86. | 57661 | 61.2% | 15.7%(+45.5)#86 | 4.9%(+56.3)#1,282 |
| 87. | 57432 | 61.1% | 15.7%(+45.4)#87 | 4.9%(+56.2)#1,289 |
| 88. | 57534 | 61.1% | 15.7%(+45.4)#88 | 4.9%(+56.2)#1,290 |
| 89. | 57257 | 60.9% | 15.7%(+45.2)#89 | 4.9%(+56.0)#1,301 |
| 90. | 57024 | 60.8% | 15.7%(+45.1)#90 | 4.9%(+55.9)#1,313 |
| 91. | 57424 | 60.5% | 15.7%(+44.8)#91 | 4.9%(+55.6)#1,339 |
| 92. | 57260 | 60.3% | 15.7%(+44.6)#92 | 4.9%(+55.4)#1,356 |
| 93. | 57452 | 59.8% | 15.7%(+44.1)#93 | 4.9%(+54.9)#1,398 |
| 94. | 57382 | 59.6% | 15.7%(+43.9)#94 | 4.9%(+54.7)#1,407 |
| 95. | 57324 | 59.2% | 15.7%(+43.5)#95 | 4.9%(+54.3)#1,437 |
| 96. | 57026 | 59.1% | 15.7%(+43.4)#96 | 4.9%(+54.2)#1,444 |
| 97. | 57332 | 59.0% | 15.7%(+43.3)#97 | 4.9%(+54.1)#1,453 |
| 98. | 57015 | 58.8% | 15.7%(+43.1)#98 | 4.9%(+53.9)#1,473 |
| 99. | 57040 | 58.8% | 15.7%(+43.1)#99 | 4.9%(+53.9)#1,481 |
| 100. | 57656 | 58.7% | 15.7%(+43.0)#100 | 4.9%(+53.8)#1,489 |
Common Questions
What are the Top 10 Zip Codes with the Highest Percentage of Households Heated by Bottled Gas / Liquid Propane in South Dakota?
Top 10 Zip Codes with the Highest Percentage of Households Heated by Bottled Gas / Liquid Propane in South Dakota are:
What zip code has the Highest Percentage of Households Heated by Bottled Gas / Liquid Propane in South Dakota?
57621 has the Highest Percentage of Households Heated by Bottled Gas / Liquid Propane in South Dakota with 100.0%.
What is the Percentage of Households Heated by Bottled Gas / Liquid Propane in the State of South Dakota?
Percentage of Households Heated by Bottled Gas / Liquid Propane in South Dakota is 15.7%.
What is the Percentage of Households Heated by Bottled Gas / Liquid Propane in the United States?
Percentage of Households Heated by Bottled Gas / Liquid Propane in the United States is 4.9%.