Zip Codes with the Highest Percentage of Households Heated by Fuel Oil / Kerosene in South Dakota
RELATED REPORTS & OPTIONS
Fuel Oil Heating
South Dakota
Compare Zip Codes
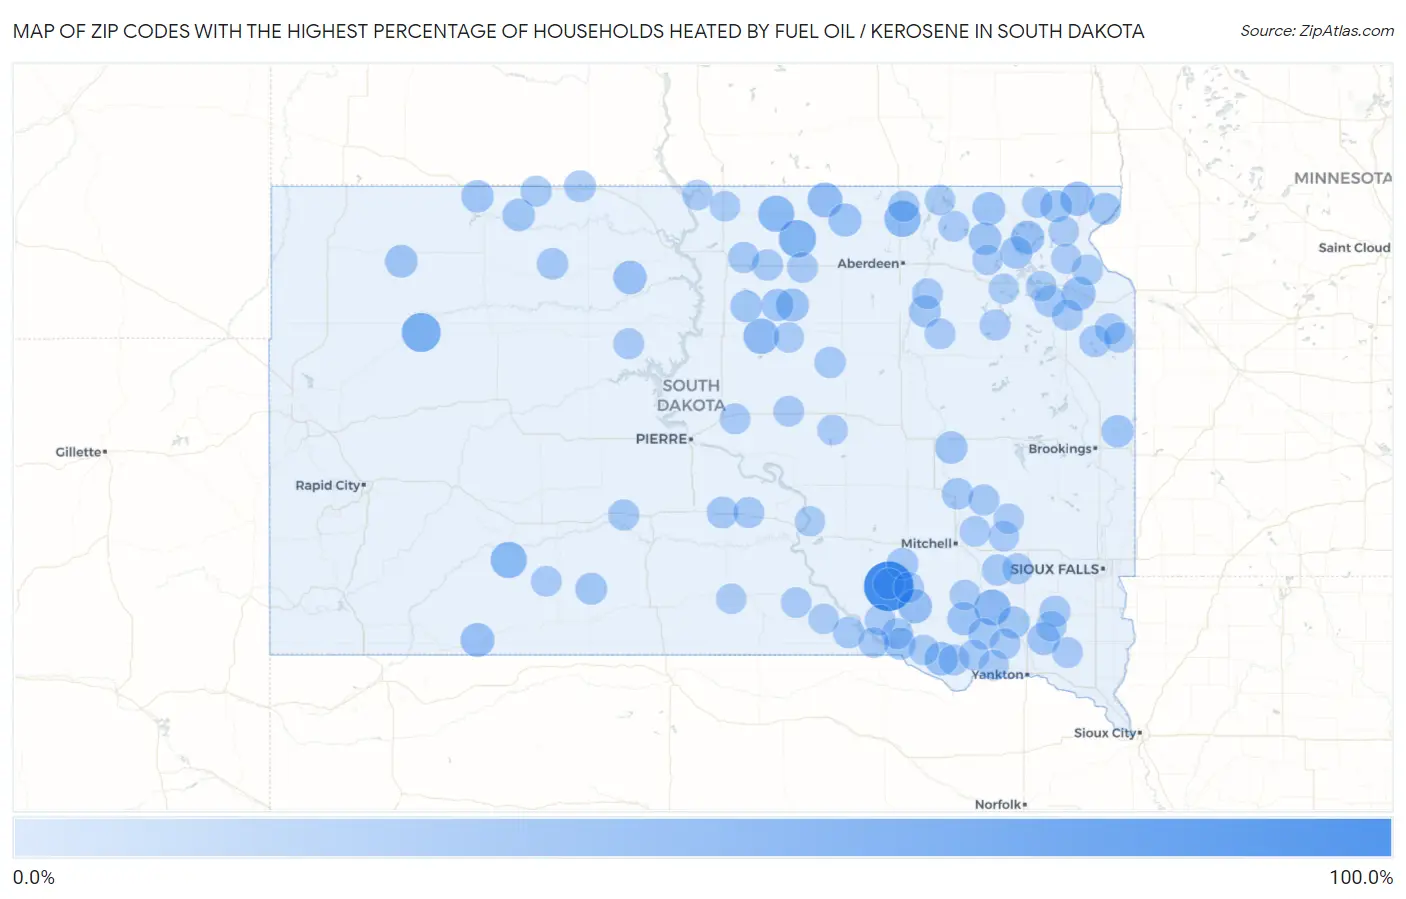
Map of Zip Codes with the Highest Percentage of Households Heated by Fuel Oil / Kerosene in South Dakota
0.0%
100.0%
Zip Codes with the Highest Percentage of Households Heated by Fuel Oil / Kerosene in South Dakota
| Zip Code | Fuel Oil Heating | vs State | vs National | |
| 1. | 57364 | 100.0% | 1.4%(+98.6)#1 | 4.2%(+95.8)#96 |
| 2. | 57758 | 47.4% | 1.4%(+46.0)#2 | 4.2%(+43.2)#2,027 |
| 3. | 57448 | 38.5% | 1.4%(+37.1)#3 | 4.2%(+34.3)#2,677 |
| 4. | 57750 | 33.3% | 1.4%(+31.9)#4 | 4.2%(+29.1)#3,079 |
| 5. | 57426 | 33.3% | 1.4%(+31.9)#5 | 4.2%(+29.1)#3,081 |
| 6. | 57437 | 32.8% | 1.4%(+31.4)#6 | 4.2%(+28.6)#3,116 |
| 7. | 57052 | 31.7% | 1.4%(+30.3)#7 | 4.2%(+27.5)#3,208 |
| 8. | 57455 | 29.6% | 1.4%(+28.2)#8 | 4.2%(+25.4)#3,366 |
| 9. | 57457 | 26.2% | 1.4%(+24.8)#9 | 4.2%(+22.0)#3,660 |
| 10. | 57313 | 23.1% | 1.4%(+21.7)#10 | 4.2%(+18.9)#3,967 |
| 11. | 57255 | 22.8% | 1.4%(+21.4)#11 | 4.2%(+18.6)#3,998 |
| 12. | 57716 | 21.6% | 1.4%(+20.2)#12 | 4.2%(+17.4)#4,111 |
| 13. | 57251 | 20.9% | 1.4%(+19.5)#13 | 4.2%(+16.7)#4,189 |
| 14. | 57232 | 20.0% | 1.4%(+18.6)#14 | 4.2%(+15.8)#4,283 |
| 15. | 57630 | 20.0% | 1.4%(+18.6)#15 | 4.2%(+15.8)#4,292 |
| 16. | 57329 | 19.3% | 1.4%(+17.9)#16 | 4.2%(+15.1)#4,369 |
| 17. | 57430 | 18.0% | 1.4%(+16.6)#17 | 4.2%(+13.8)#4,517 |
| 18. | 57456 | 17.9% | 1.4%(+16.5)#18 | 4.2%(+13.7)#4,538 |
| 19. | 57376 | 17.3% | 1.4%(+15.9)#19 | 4.2%(+13.1)#4,628 |
| 20. | 57466 | 17.3% | 1.4%(+15.9)#20 | 4.2%(+13.1)#4,633 |
| 21. | 57037 | 16.2% | 1.4%(+14.8)#21 | 4.2%(+12.0)#4,800 |
| 22. | 57649 | 16.2% | 1.4%(+14.8)#22 | 4.2%(+12.0)#4,803 |
| 23. | 57454 | 15.5% | 1.4%(+14.1)#23 | 4.2%(+11.3)#4,922 |
| 24. | 57634 | 15.2% | 1.4%(+13.8)#24 | 4.2%(+11.0)#4,968 |
| 25. | 57324 | 15.1% | 1.4%(+13.7)#25 | 4.2%(+10.9)#4,981 |
| 26. | 57261 | 15.1% | 1.4%(+13.7)#26 | 4.2%(+10.9)#4,983 |
| 27. | 57638 | 14.6% | 1.4%(+13.2)#27 | 4.2%(+10.4)#5,073 |
| 28. | 57276 | 14.4% | 1.4%(+13.0)#28 | 4.2%(+10.2)#5,108 |
| 29. | 57475 | 14.3% | 1.4%(+12.9)#29 | 4.2%(+10.1)#5,133 |
| 30. | 57045 | 13.1% | 1.4%(+11.7)#30 | 4.2%(+8.90)#5,334 |
| 31. | 57429 | 12.8% | 1.4%(+11.4)#31 | 4.2%(+8.60)#5,405 |
| 32. | 57560 | 12.3% | 1.4%(+10.9)#32 | 4.2%(+8.10)#5,514 |
| 33. | 57224 | 12.3% | 1.4%(+10.9)#33 | 4.2%(+8.10)#5,516 |
| 34. | 57367 | 12.0% | 1.4%(+10.6)#34 | 4.2%(+7.80)#5,587 |
| 35. | 57260 | 11.8% | 1.4%(+10.4)#35 | 4.2%(+7.60)#5,626 |
| 36. | 57450 | 11.7% | 1.4%(+10.3)#36 | 4.2%(+7.50)#5,658 |
| 37. | 57317 | 11.3% | 1.4%(+9.90)#37 | 4.2%(+7.10)#5,747 |
| 38. | 57265 | 11.1% | 1.4%(+9.70)#38 | 4.2%(+6.90)#5,806 |
| 39. | 57375 | 11.0% | 1.4%(+9.60)#39 | 4.2%(+6.80)#5,832 |
| 40. | 57568 | 10.9% | 1.4%(+9.50)#40 | 4.2%(+6.70)#5,857 |
| 41. | 57641 | 10.9% | 1.4%(+9.50)#41 | 4.2%(+6.70)#5,859 |
| 42. | 57256 | 10.6% | 1.4%(+9.20)#42 | 4.2%(+6.40)#5,937 |
| 43. | 57633 | 10.2% | 1.4%(+8.80)#43 | 4.2%(+6.00)#6,032 |
| 44. | 57314 | 9.9% | 1.4%(+8.50)#44 | 4.2%(+5.70)#6,101 |
| 45. | 57059 | 9.7% | 1.4%(+8.30)#45 | 4.2%(+5.50)#6,158 |
| 46. | 57332 | 9.4% | 1.4%(+8.00)#46 | 4.2%(+5.20)#6,249 |
| 47. | 57428 | 9.1% | 1.4%(+7.70)#47 | 4.2%(+4.90)#6,341 |
| 48. | 57562 | 9.1% | 1.4%(+7.70)#48 | 4.2%(+4.90)#6,345 |
| 49. | 57467 | 8.9% | 1.4%(+7.50)#49 | 4.2%(+4.70)#6,397 |
| 50. | 57452 | 8.9% | 1.4%(+7.50)#50 | 4.2%(+4.70)#6,401 |
| 51. | 57337 | 8.8% | 1.4%(+7.40)#51 | 4.2%(+4.60)#6,444 |
| 52. | 57441 | 8.7% | 1.4%(+7.30)#52 | 4.2%(+4.50)#6,469 |
| 53. | 57356 | 8.4% | 1.4%(+7.00)#53 | 4.2%(+4.20)#6,550 |
| 54. | 57036 | 8.4% | 1.4%(+7.00)#54 | 4.2%(+4.20)#6,561 |
| 55. | 57263 | 8.3% | 1.4%(+6.90)#55 | 4.2%(+4.10)#6,609 |
| 56. | 57344 | 8.3% | 1.4%(+6.90)#56 | 4.2%(+4.10)#6,614 |
| 57. | 57645 | 8.2% | 1.4%(+6.80)#57 | 4.2%(+4.00)#6,655 |
| 58. | 57544 | 8.0% | 1.4%(+6.60)#58 | 4.2%(+3.80)#6,724 |
| 59. | 57315 | 7.7% | 1.4%(+6.30)#59 | 4.2%(+3.50)#6,840 |
| 60. | 57625 | 7.6% | 1.4%(+6.20)#60 | 4.2%(+3.40)#6,877 |
| 61. | 57217 | 7.6% | 1.4%(+6.20)#61 | 4.2%(+3.40)#6,900 |
| 62. | 57319 | 7.4% | 1.4%(+6.00)#62 | 4.2%(+3.20)#6,973 |
| 63. | 57345 | 7.3% | 1.4%(+5.90)#63 | 4.2%(+3.10)#7,008 |
| 64. | 57040 | 7.2% | 1.4%(+5.80)#64 | 4.2%(+3.00)#7,048 |
| 65. | 57471 | 7.1% | 1.4%(+5.70)#65 | 4.2%(+2.90)#7,089 |
| 66. | 57432 | 7.1% | 1.4%(+5.70)#66 | 4.2%(+2.90)#7,098 |
| 67. | 57474 | 7.1% | 1.4%(+5.70)#67 | 4.2%(+2.90)#7,099 |
| 68. | 57522 | 7.0% | 1.4%(+5.60)#68 | 4.2%(+2.80)#7,139 |
| 69. | 57066 | 6.8% | 1.4%(+5.40)#69 | 4.2%(+2.60)#7,205 |
| 70. | 57073 | 6.8% | 1.4%(+5.40)#70 | 4.2%(+2.60)#7,211 |
| 71. | 57477 | 6.8% | 1.4%(+5.40)#71 | 4.2%(+2.60)#7,221 |
| 72. | 57342 | 6.7% | 1.4%(+5.30)#72 | 4.2%(+2.50)#7,272 |
| 73. | 57246 | 6.7% | 1.4%(+5.30)#73 | 4.2%(+2.50)#7,277 |
| 74. | 57279 | 6.6% | 1.4%(+5.20)#74 | 4.2%(+2.40)#7,313 |
| 75. | 57577 | 6.5% | 1.4%(+5.10)#75 | 4.2%(+2.30)#7,352 |
| 76. | 57328 | 6.4% | 1.4%(+5.00)#76 | 4.2%(+2.20)#7,403 |
| 77. | 57270 | 6.4% | 1.4%(+5.00)#77 | 4.2%(+2.20)#7,407 |
| 78. | 57335 | 6.3% | 1.4%(+4.90)#78 | 4.2%(+2.10)#7,464 |
| 79. | 57340 | 6.3% | 1.4%(+4.90)#79 | 4.2%(+2.10)#7,467 |
| 80. | 57533 | 6.1% | 1.4%(+4.70)#80 | 4.2%(+1.90)#7,547 |
| 81. | 57366 | 6.0% | 1.4%(+4.60)#81 | 4.2%(+1.80)#7,578 |
| 82. | 57380 | 5.9% | 1.4%(+4.50)#82 | 4.2%(+1.70)#7,634 |
| 83. | 57070 | 5.9% | 1.4%(+4.50)#83 | 4.2%(+1.70)#7,652 |
| 84. | 57374 | 5.8% | 1.4%(+4.40)#84 | 4.2%(+1.60)#7,701 |
| 85. | 57273 | 5.7% | 1.4%(+4.30)#85 | 4.2%(+1.50)#7,756 |
| 86. | 57523 | 5.7% | 1.4%(+4.30)#86 | 4.2%(+1.50)#7,761 |
| 87. | 57321 | 5.7% | 1.4%(+4.30)#87 | 4.2%(+1.50)#7,766 |
| 88. | 57580 | 5.5% | 1.4%(+4.10)#88 | 4.2%(+1.30)#7,845 |
| 89. | 57446 | 5.5% | 1.4%(+4.10)#89 | 4.2%(+1.30)#7,870 |
| 90. | 57262 | 5.4% | 1.4%(+4.00)#90 | 4.2%(+1.20)#7,900 |
| 91. | 57473 | 5.4% | 1.4%(+4.00)#91 | 4.2%(+1.20)#7,933 |
| 92. | 57362 | 5.3% | 1.4%(+3.90)#92 | 4.2%(+1.10)#7,971 |
| 93. | 57648 | 5.3% | 1.4%(+3.90)#93 | 4.2%(+1.10)#7,986 |
| 94. | 57063 | 5.2% | 1.4%(+3.80)#94 | 4.2%(+1.00)#8,035 |
| 95. | 57259 | 5.1% | 1.4%(+3.70)#95 | 4.2%(+0.900)#8,104 |
| 96. | 57257 | 5.1% | 1.4%(+3.70)#96 | 4.2%(+0.900)#8,106 |
| 97. | 57632 | 5.0% | 1.4%(+3.60)#97 | 4.2%(+0.800)#8,146 |
| 98. | 57274 | 4.9% | 1.4%(+3.50)#98 | 4.2%(+0.700)#8,182 |
| 99. | 57325 | 4.8% | 1.4%(+3.40)#99 | 4.2%(+0.600)#8,245 |
| 100. | 57468 | 4.8% | 1.4%(+3.40)#100 | 4.2%(+0.600)#8,286 |
Common Questions
What are the Top 10 Zip Codes with the Highest Percentage of Households Heated by Fuel Oil / Kerosene in South Dakota?
Top 10 Zip Codes with the Highest Percentage of Households Heated by Fuel Oil / Kerosene in South Dakota are:
What zip code has the Highest Percentage of Households Heated by Fuel Oil / Kerosene in South Dakota?
57364 has the Highest Percentage of Households Heated by Fuel Oil / Kerosene in South Dakota with 100.0%.
What is the Percentage of Households Heated by Fuel Oil / Kerosene in the State of South Dakota?
Percentage of Households Heated by Fuel Oil / Kerosene in South Dakota is 1.4%.
What is the Percentage of Households Heated by Fuel Oil / Kerosene in the United States?
Percentage of Households Heated by Fuel Oil / Kerosene in the United States is 4.2%.