Zip Codes with the Highest Percentage of Population Employed in Food Preparation & Serving in Dublin, OH
RELATED REPORTS & OPTIONS
Food Preparation & Serving
Dublin
Compare Zip Codes
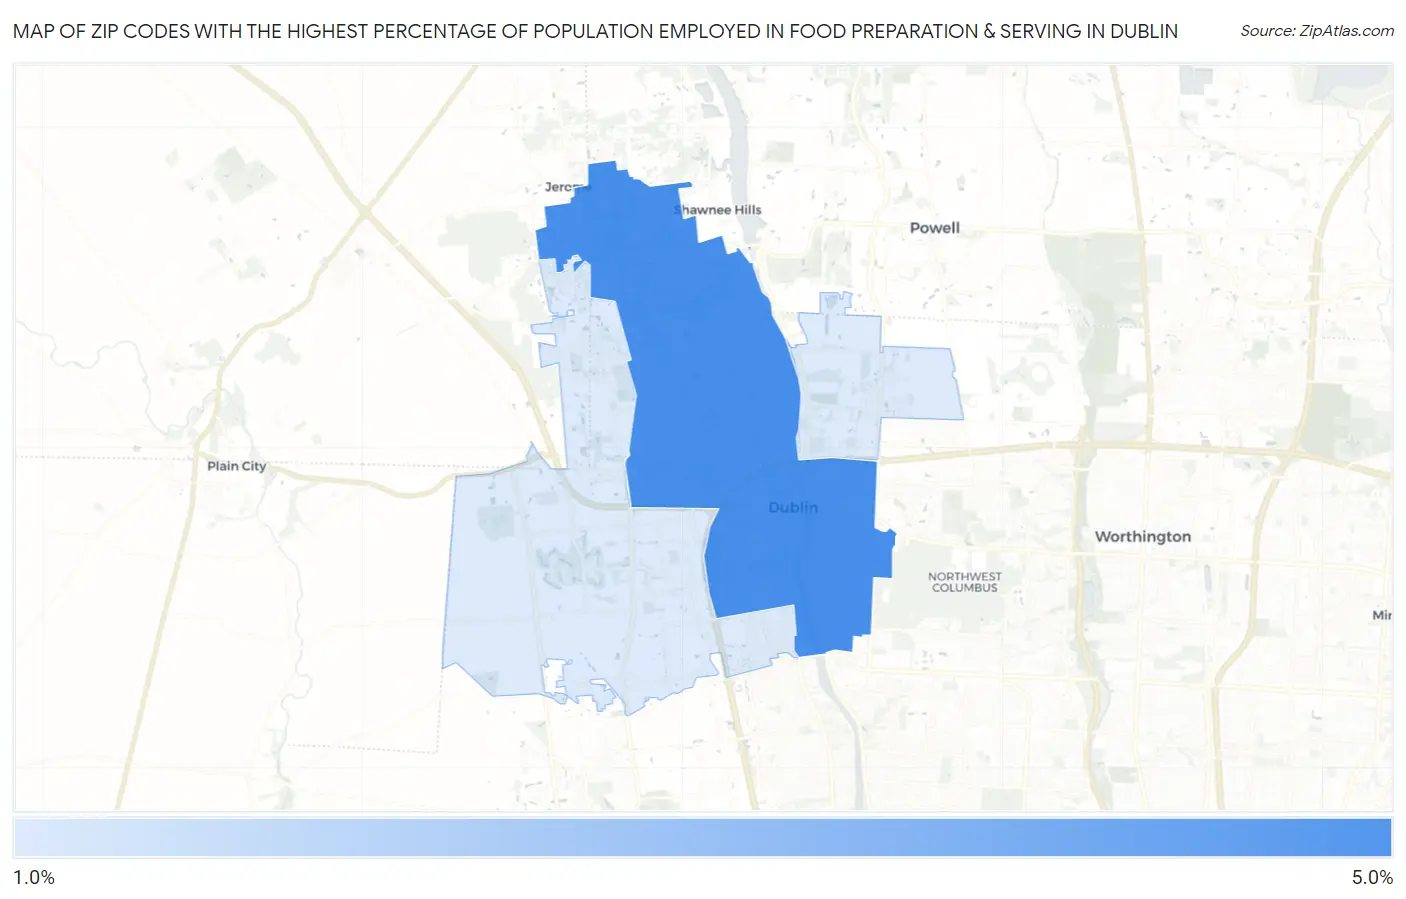
Map of Zip Codes with the Highest Percentage of Population Employed in Food Preparation & Serving in Dublin
1.8%
4.1%
Zip Codes with the Highest Percentage of Population Employed in Food Preparation & Serving in Dublin, OH
| Zip Code | % Employed | vs State | vs National | |
| 1. | 43017 | 4.1% | 5.6%(-1.47)#712 | 5.3%(-1.15)#16,567 |
| 2. | 43016 | 1.8% | 5.6%(-3.84)#1,021 | 5.3%(-3.52)#25,345 |
1
Common Questions
What are the Top Zip Codes with the Highest Percentage of Population Employed in Food Preparation & Serving in Dublin, OH?
Top Zip Codes with the Highest Percentage of Population Employed in Food Preparation & Serving in Dublin, OH are:
What zip code has the Highest Percentage of Population Employed in Food Preparation & Serving in Dublin, OH?
43017 has the Highest Percentage of Population Employed in Food Preparation & Serving in Dublin, OH with 4.1%.
What is the Percentage of Population Employed in Food Preparation & Serving in Dublin, OH?
Percentage of Population Employed in Food Preparation & Serving in Dublin is 2.2%.
What is the Percentage of Population Employed in Food Preparation & Serving in Ohio?
Percentage of Population Employed in Food Preparation & Serving in Ohio is 5.6%.
What is the Percentage of Population Employed in Food Preparation & Serving in the United States?
Percentage of Population Employed in Food Preparation & Serving in the United States is 5.3%.