Zip Codes with the Highest Percentage of Population Employed in Food Preparation & Serving in Warren, OH
RELATED REPORTS & OPTIONS
Food Preparation & Serving
Warren
Compare Zip Codes
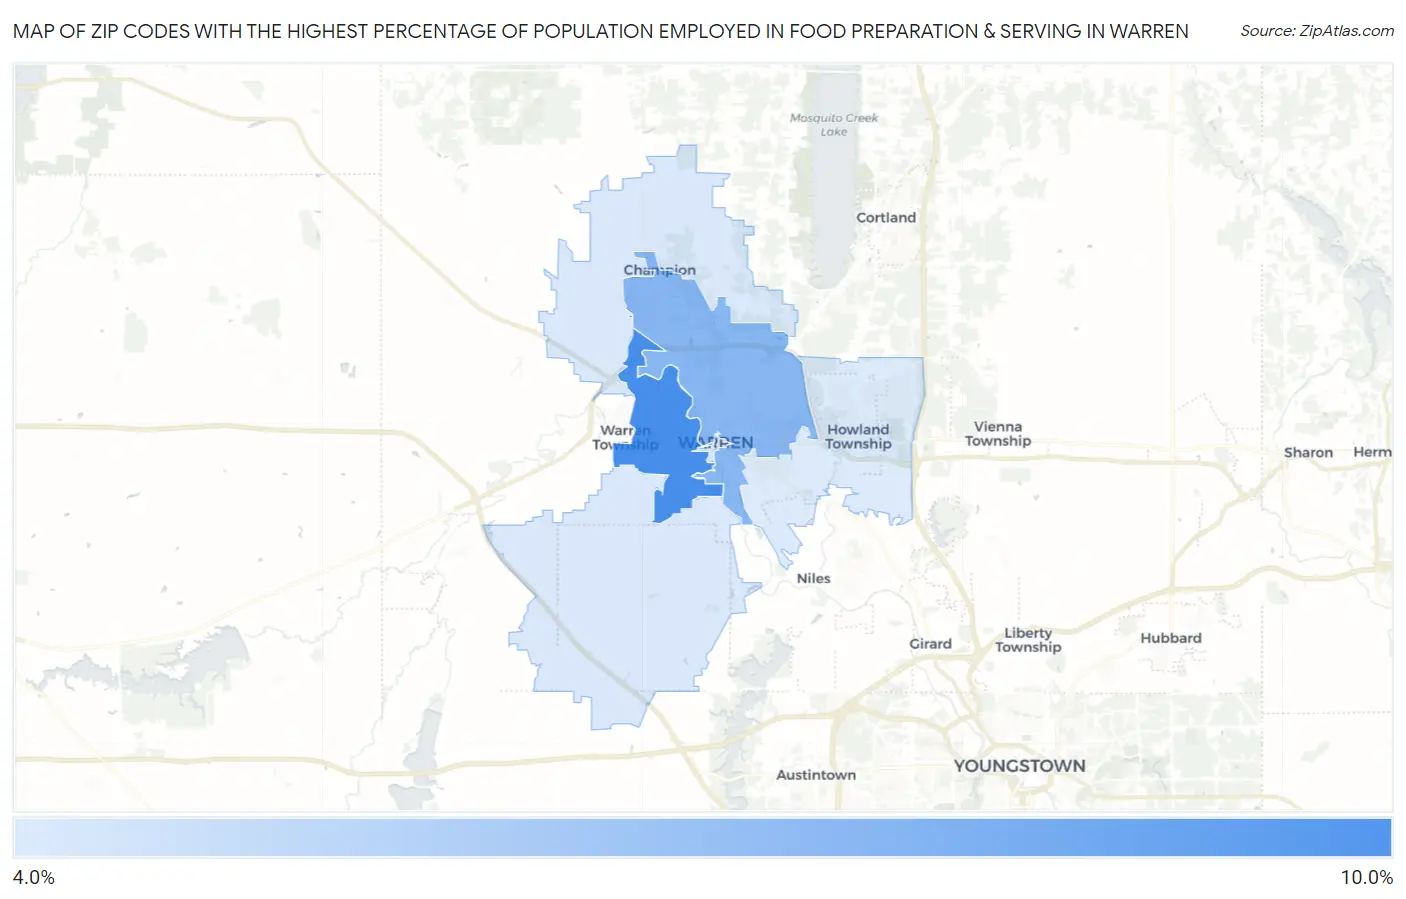
Map of Zip Codes with the Highest Percentage of Population Employed in Food Preparation & Serving in Warren
4.2%
8.7%
Zip Codes with the Highest Percentage of Population Employed in Food Preparation & Serving in Warren, OH
| Zip Code | % Employed | vs State | vs National | |
| 1. | 44485 | 8.7% | 5.6%(+3.11)#177 | 5.3%(+3.43)#3,831 |
| 2. | 44483 | 6.7% | 5.6%(+1.13)#322 | 5.3%(+1.45)#7,234 |
| 3. | 44481 | 4.3% | 5.6%(-1.32)#689 | 5.3%(-0.997)#15,930 |
| 4. | 44484 | 4.2% | 5.6%(-1.39)#703 | 5.3%(-1.07)#16,256 |
1
Common Questions
What are the Top 3 Zip Codes with the Highest Percentage of Population Employed in Food Preparation & Serving in Warren, OH?
Top 3 Zip Codes with the Highest Percentage of Population Employed in Food Preparation & Serving in Warren, OH are:
What zip code has the Highest Percentage of Population Employed in Food Preparation & Serving in Warren, OH?
44485 has the Highest Percentage of Population Employed in Food Preparation & Serving in Warren, OH with 8.7%.
What is the Percentage of Population Employed in Food Preparation & Serving in Warren, OH?
Percentage of Population Employed in Food Preparation & Serving in Warren is 8.6%.
What is the Percentage of Population Employed in Food Preparation & Serving in Ohio?
Percentage of Population Employed in Food Preparation & Serving in Ohio is 5.6%.
What is the Percentage of Population Employed in Food Preparation & Serving in the United States?
Percentage of Population Employed in Food Preparation & Serving in the United States is 5.3%.