Zip Codes with the Highest Percentage of Population Employed in Food Preparation & Serving in Cleveland, OH
RELATED REPORTS & OPTIONS
Food Preparation & Serving
Cleveland
Compare Zip Codes
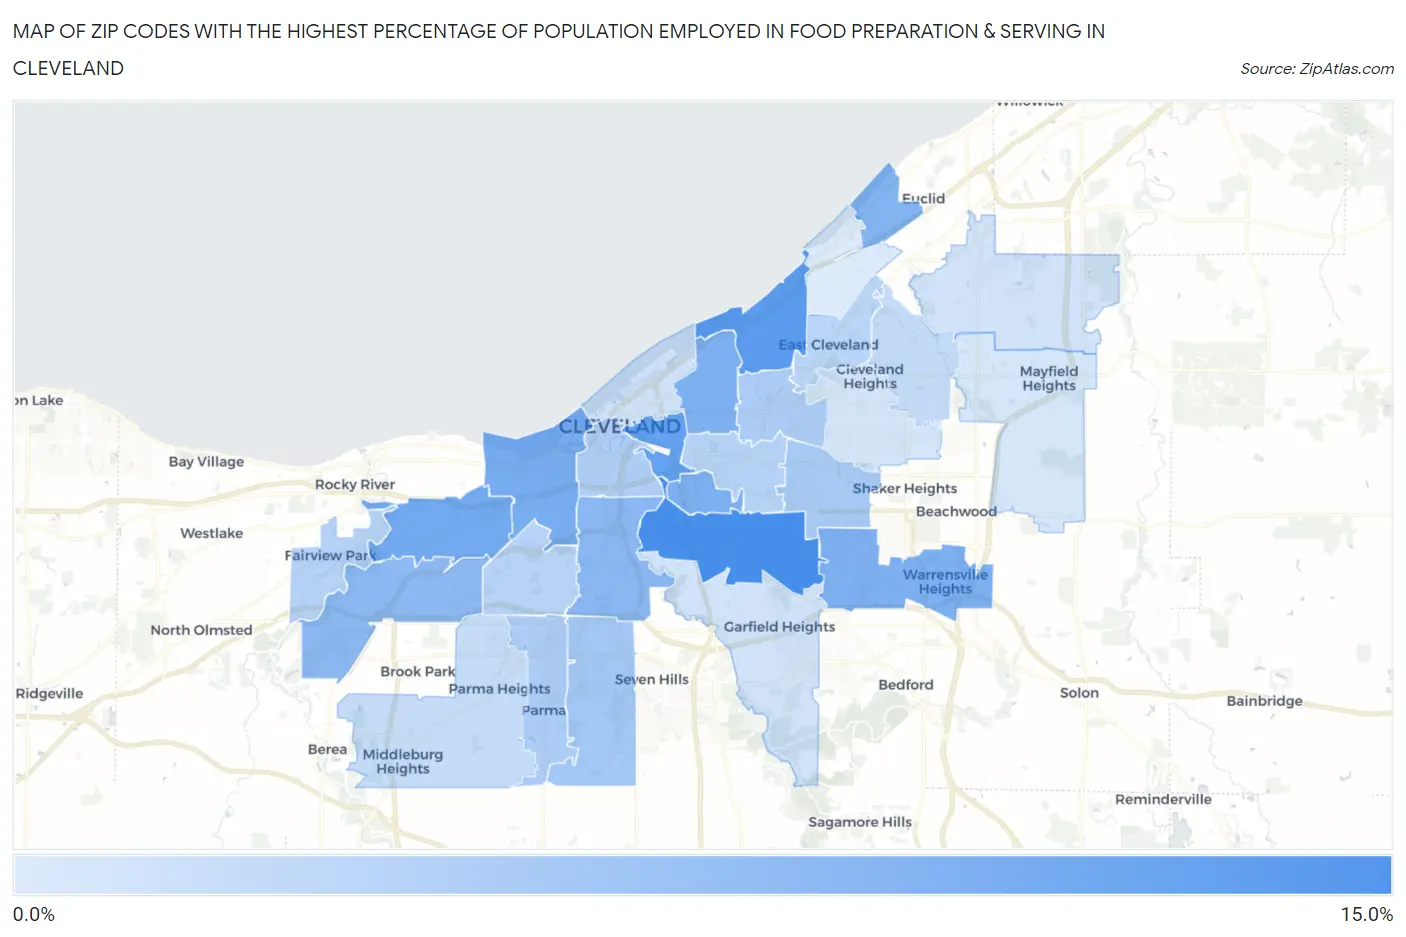
Map of Zip Codes with the Highest Percentage of Population Employed in Food Preparation & Serving in Cleveland
3.2%
10.6%
Zip Codes with the Highest Percentage of Population Employed in Food Preparation & Serving in Cleveland, OH
| Zip Code | % Employed | vs State | vs National | |
| 1. | 44105 | 10.6% | 5.6%(+5.01)#104 | 5.3%(+5.33)#2,255 |
| 2. | 44108 | 9.6% | 5.6%(+3.98)#134 | 5.3%(+4.30)#2,983 |
| 3. | 44115 | 9.2% | 5.6%(+3.55)#151 | 5.3%(+3.87)#3,365 |
| 4. | 44111 | 8.4% | 5.6%(+2.75)#197 | 5.3%(+3.07)#4,236 |
| 5. | 44102 | 8.2% | 5.6%(+2.58)#206 | 5.3%(+2.89)#4,464 |
| 6. | 44127 | 7.9% | 5.6%(+2.28)#227 | 5.3%(+2.60)#4,909 |
| 7. | 44103 | 7.9% | 5.6%(+2.25)#231 | 5.3%(+2.57)#4,961 |
| 8. | 44128 | 7.8% | 5.6%(+2.19)#234 | 5.3%(+2.51)#5,056 |
| 9. | 44119 | 7.6% | 5.6%(+2.01)#246 | 5.3%(+2.33)#5,349 |
| 10. | 44109 | 7.2% | 5.6%(+1.63)#278 | 5.3%(+1.95)#6,049 |
| 11. | 44135 | 7.1% | 5.6%(+1.52)#291 | 5.3%(+1.84)#6,293 |
| 12. | 44134 | 6.0% | 5.6%(+0.443)#407 | 5.3%(+0.762)#9,179 |
| 13. | 44120 | 5.8% | 5.6%(+0.199)#438 | 5.3%(+0.519)#10,023 |
| 14. | 44106 | 5.5% | 5.6%(-0.082)#477 | 5.3%(+0.238)#10,984 |
| 15. | 44129 | 5.5% | 5.6%(-0.109)#480 | 5.3%(+0.211)#11,073 |
| 16. | 44113 | 5.5% | 5.6%(-0.130)#483 | 5.3%(+0.190)#11,137 |
| 17. | 44104 | 5.1% | 5.6%(-0.457)#534 | 5.3%(-0.137)#12,367 |
| 18. | 44126 | 5.1% | 5.6%(-0.481)#538 | 5.3%(-0.161)#12,451 |
| 19. | 44144 | 5.0% | 5.6%(-0.566)#556 | 5.3%(-0.247)#12,785 |
| 20. | 44112 | 4.8% | 5.6%(-0.784)#600 | 5.3%(-0.464)#13,672 |
| 21. | 44121 | 4.4% | 5.6%(-1.17)#662 | 5.3%(-0.851)#15,270 |
| 22. | 44130 | 4.4% | 5.6%(-1.24)#672 | 5.3%(-0.918)#15,560 |
| 23. | 44114 | 3.9% | 5.6%(-1.70)#752 | 5.3%(-1.38)#17,519 |
| 24. | 44143 | 3.8% | 5.6%(-1.85)#778 | 5.3%(-1.53)#18,094 |
| 25. | 44125 | 3.7% | 5.6%(-1.90)#786 | 5.3%(-1.58)#18,299 |
| 26. | 44118 | 3.6% | 5.6%(-2.04)#809 | 5.3%(-1.72)#18,922 |
| 27. | 44124 | 3.5% | 5.6%(-2.07)#811 | 5.3%(-1.75)#19,049 |
| 28. | 44110 | 3.2% | 5.6%(-2.40)#864 | 5.3%(-2.08)#20,450 |
1
Common Questions
What are the Top 10 Zip Codes with the Highest Percentage of Population Employed in Food Preparation & Serving in Cleveland, OH?
Top 10 Zip Codes with the Highest Percentage of Population Employed in Food Preparation & Serving in Cleveland, OH are:
What zip code has the Highest Percentage of Population Employed in Food Preparation & Serving in Cleveland, OH?
44105 has the Highest Percentage of Population Employed in Food Preparation & Serving in Cleveland, OH with 10.6%.
What is the Percentage of Population Employed in Food Preparation & Serving in Cleveland, OH?
Percentage of Population Employed in Food Preparation & Serving in Cleveland is 7.2%.
What is the Percentage of Population Employed in Food Preparation & Serving in Ohio?
Percentage of Population Employed in Food Preparation & Serving in Ohio is 5.6%.
What is the Percentage of Population Employed in Food Preparation & Serving in the United States?
Percentage of Population Employed in Food Preparation & Serving in the United States is 5.3%.