Zip Codes with the Highest Percentage of Population Employed in Food Preparation & Serving in Canton, OH
RELATED REPORTS & OPTIONS
Food Preparation & Serving
Canton
Compare Zip Codes
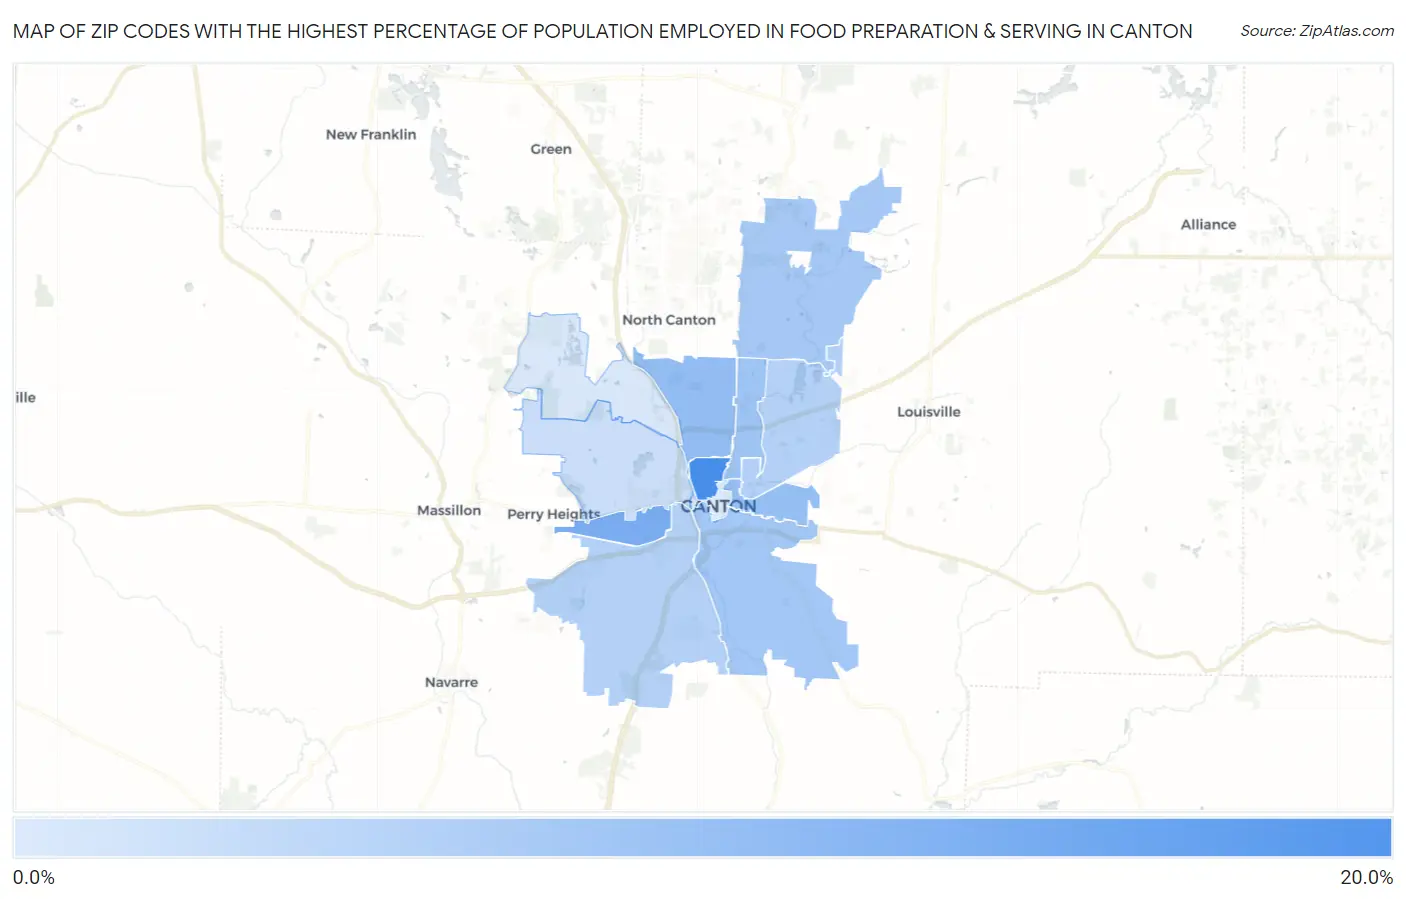
Map of Zip Codes with the Highest Percentage of Population Employed in Food Preparation & Serving in Canton
3.8%
15.1%
Zip Codes with the Highest Percentage of Population Employed in Food Preparation & Serving in Canton, OH
| Zip Code | % Employed | vs State | vs National | |
| 1. | 44703 | 15.1% | 5.6%(+9.52)#37 | 5.3%(+9.84)#965 |
| 2. | 44710 | 11.1% | 5.6%(+5.47)#95 | 5.3%(+5.79)#2,023 |
| 3. | 44709 | 9.3% | 5.6%(+3.69)#147 | 5.3%(+4.01)#3,243 |
| 4. | 44704 | 9.1% | 5.6%(+3.45)#161 | 5.3%(+3.77)#3,465 |
| 5. | 44714 | 8.4% | 5.6%(+2.79)#194 | 5.3%(+3.11)#4,181 |
| 6. | 44707 | 8.1% | 5.6%(+2.47)#213 | 5.3%(+2.79)#4,614 |
| 7. | 44721 | 7.9% | 5.6%(+2.27)#228 | 5.3%(+2.59)#4,920 |
| 8. | 44705 | 6.9% | 5.6%(+1.26)#312 | 5.3%(+1.58)#6,903 |
| 9. | 44706 | 6.7% | 5.6%(+1.12)#324 | 5.3%(+1.44)#7,280 |
| 10. | 44708 | 5.0% | 5.6%(-0.568)#557 | 5.3%(-0.248)#12,789 |
| 11. | 44718 | 4.0% | 5.6%(-1.57)#728 | 5.3%(-1.26)#17,000 |
| 12. | 44702 | 3.8% | 5.6%(-1.82)#771 | 5.3%(-1.50)#18,010 |
1
Common Questions
What are the Top 10 Zip Codes with the Highest Percentage of Population Employed in Food Preparation & Serving in Canton, OH?
Top 10 Zip Codes with the Highest Percentage of Population Employed in Food Preparation & Serving in Canton, OH are:
What zip code has the Highest Percentage of Population Employed in Food Preparation & Serving in Canton, OH?
44703 has the Highest Percentage of Population Employed in Food Preparation & Serving in Canton, OH with 15.1%.
What is the Percentage of Population Employed in Food Preparation & Serving in Canton, OH?
Percentage of Population Employed in Food Preparation & Serving in Canton is 9.9%.
What is the Percentage of Population Employed in Food Preparation & Serving in Ohio?
Percentage of Population Employed in Food Preparation & Serving in Ohio is 5.6%.
What is the Percentage of Population Employed in Food Preparation & Serving in the United States?
Percentage of Population Employed in Food Preparation & Serving in the United States is 5.3%.