Zip Codes with the Highest Percentage of Population Employed in Food Preparation & Serving in Hamilton, OH
RELATED REPORTS & OPTIONS
Food Preparation & Serving
Hamilton
Compare Zip Codes
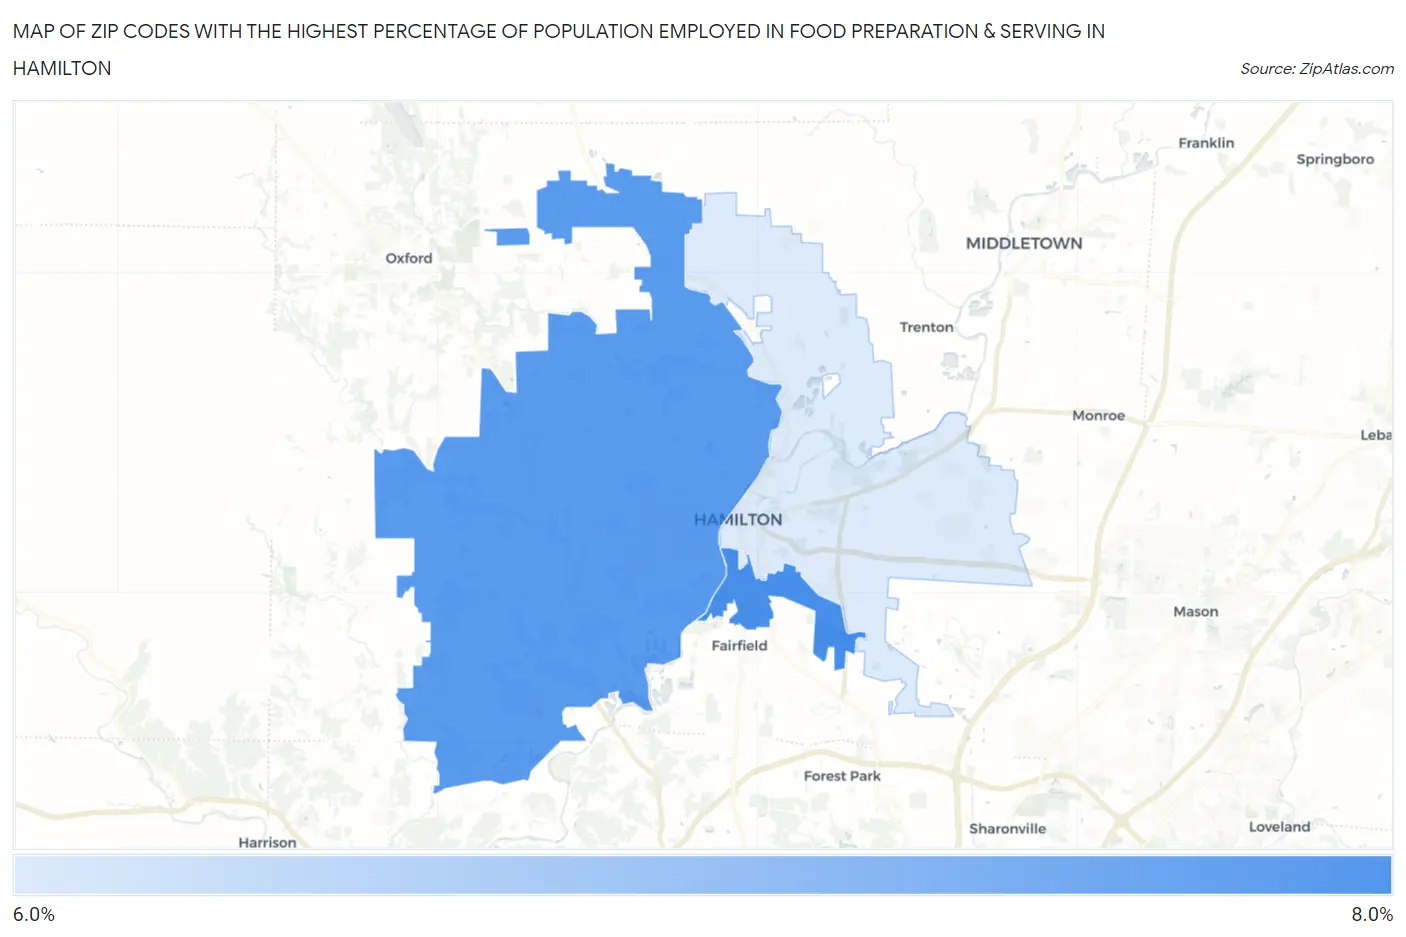
Map of Zip Codes with the Highest Percentage of Population Employed in Food Preparation & Serving in Hamilton
6.6%
7.9%
Zip Codes with the Highest Percentage of Population Employed in Food Preparation & Serving in Hamilton, OH
| Zip Code | % Employed | vs State | vs National | |
| 1. | 45015 | 7.9% | 5.6%(+2.30)#225 | 5.3%(+2.62)#4,873 |
| 2. | 45013 | 7.8% | 5.6%(+2.17)#236 | 5.3%(+2.49)#5,101 |
| 3. | 45011 | 6.6% | 5.6%(+0.955)#342 | 5.3%(+1.27)#7,698 |
1
Common Questions
What are the Top Zip Codes with the Highest Percentage of Population Employed in Food Preparation & Serving in Hamilton, OH?
Top Zip Codes with the Highest Percentage of Population Employed in Food Preparation & Serving in Hamilton, OH are:
What zip code has the Highest Percentage of Population Employed in Food Preparation & Serving in Hamilton, OH?
45015 has the Highest Percentage of Population Employed in Food Preparation & Serving in Hamilton, OH with 7.9%.
What is the Percentage of Population Employed in Food Preparation & Serving in Hamilton, OH?
Percentage of Population Employed in Food Preparation & Serving in Hamilton is 8.1%.
What is the Percentage of Population Employed in Food Preparation & Serving in Ohio?
Percentage of Population Employed in Food Preparation & Serving in Ohio is 5.6%.
What is the Percentage of Population Employed in Food Preparation & Serving in the United States?
Percentage of Population Employed in Food Preparation & Serving in the United States is 5.3%.