Zip Codes with the Highest Percentage of Population Employed in Food Preparation & Serving in Westerville, OH
RELATED REPORTS & OPTIONS
Food Preparation & Serving
Westerville
Compare Zip Codes
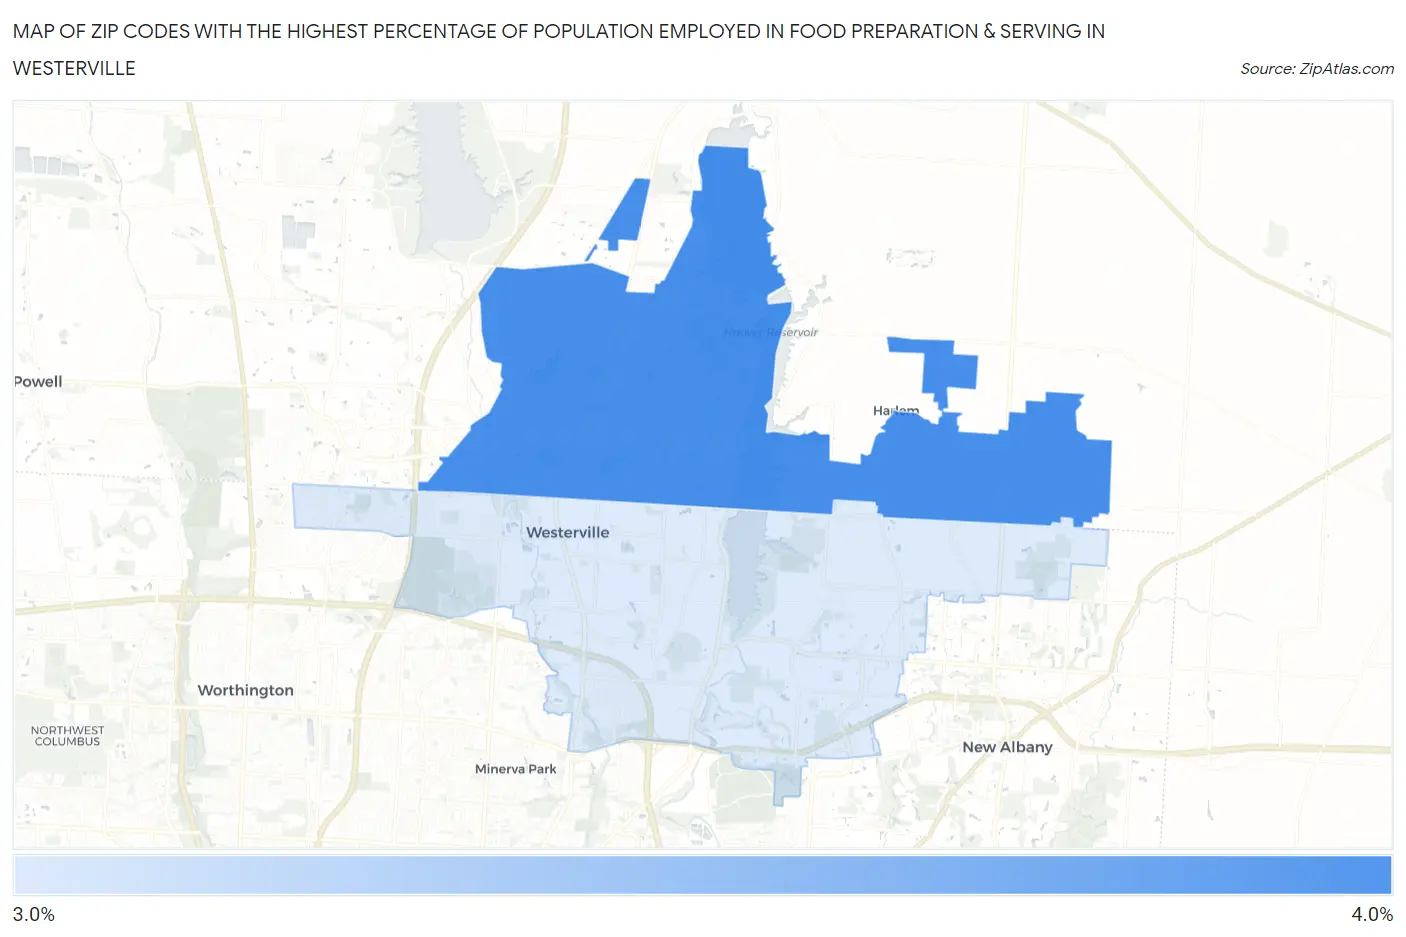
Map of Zip Codes with the Highest Percentage of Population Employed in Food Preparation & Serving in Westerville
3.6%
3.8%
Zip Codes with the Highest Percentage of Population Employed in Food Preparation & Serving in Westerville, OH
| Zip Code | % Employed | vs State | vs National | |
| 1. | 43082 | 3.8% | 5.6%(-1.83)#774 | 5.3%(-1.51)#18,049 |
| 2. | 43081 | 3.6% | 5.6%(-2.02)#805 | 5.3%(-1.70)#18,847 |
1
Common Questions
What are the Top Zip Codes with the Highest Percentage of Population Employed in Food Preparation & Serving in Westerville, OH?
Top Zip Codes with the Highest Percentage of Population Employed in Food Preparation & Serving in Westerville, OH are:
What zip code has the Highest Percentage of Population Employed in Food Preparation & Serving in Westerville, OH?
43082 has the Highest Percentage of Population Employed in Food Preparation & Serving in Westerville, OH with 3.8%.
What is the Percentage of Population Employed in Food Preparation & Serving in Westerville, OH?
Percentage of Population Employed in Food Preparation & Serving in Westerville is 3.8%.
What is the Percentage of Population Employed in Food Preparation & Serving in Ohio?
Percentage of Population Employed in Food Preparation & Serving in Ohio is 5.6%.
What is the Percentage of Population Employed in Food Preparation & Serving in the United States?
Percentage of Population Employed in Food Preparation & Serving in the United States is 5.3%.