Zip Codes with the Highest Percentage of Population Employed in Food Preparation & Serving in Kent, OH
RELATED REPORTS & OPTIONS
Food Preparation & Serving
Kent
Compare Zip Codes
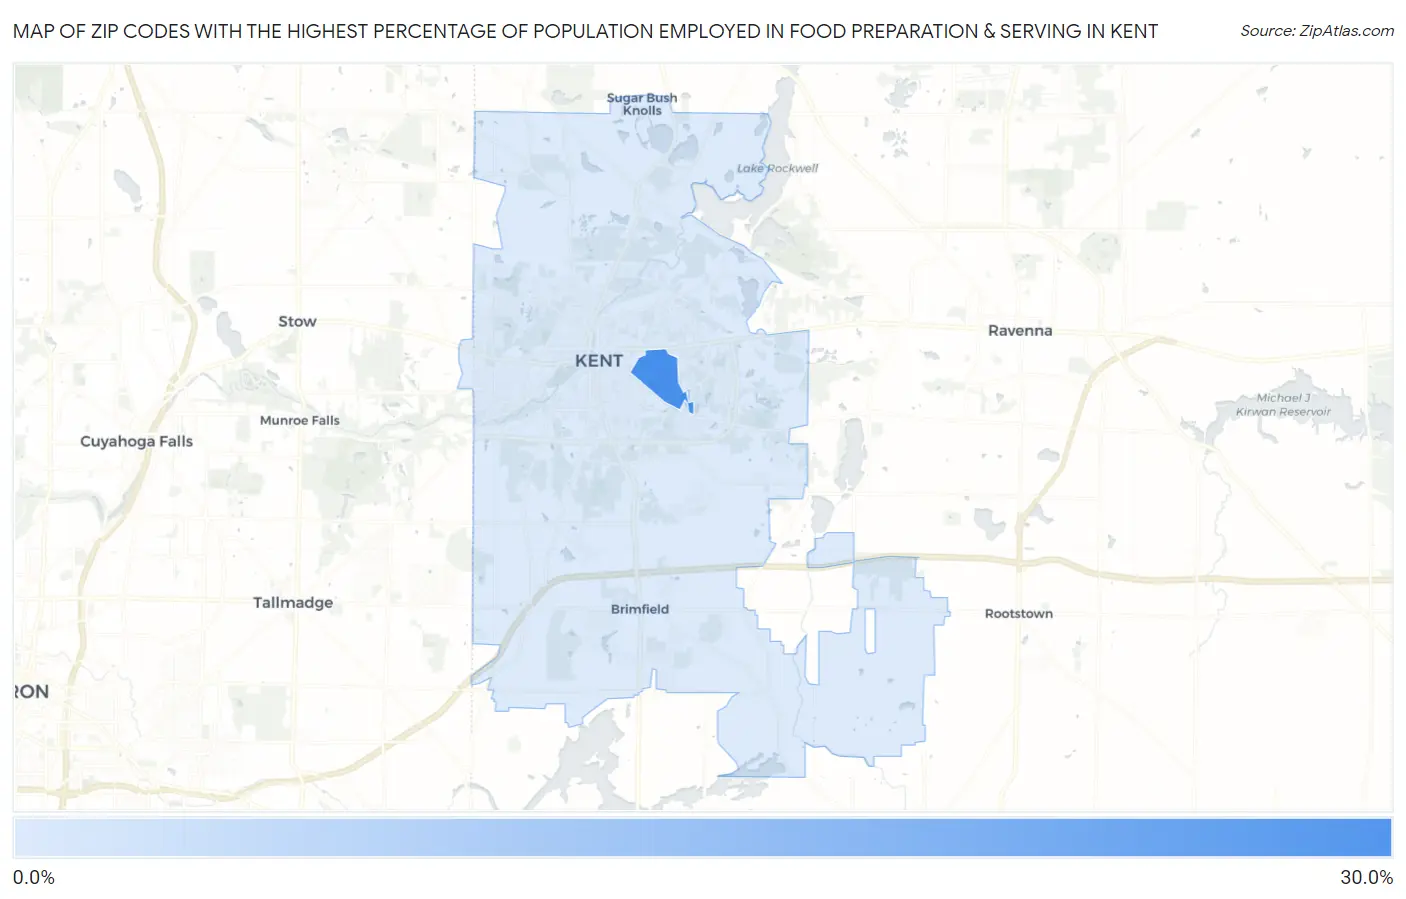
Map of Zip Codes with the Highest Percentage of Population Employed in Food Preparation & Serving in Kent
9.9%
29.2%
Zip Codes with the Highest Percentage of Population Employed in Food Preparation & Serving in Kent, OH
| Zip Code | % Employed | vs State | vs National | |
| 1. | 44243 | 29.2% | 5.6%(+23.6)#8 | 5.3%(+24.0)#228 |
| 2. | 44240 | 9.9% | 5.6%(+4.25)#125 | 5.3%(+4.57)#2,746 |
1
Common Questions
What are the Top Zip Codes with the Highest Percentage of Population Employed in Food Preparation & Serving in Kent, OH?
Top Zip Codes with the Highest Percentage of Population Employed in Food Preparation & Serving in Kent, OH are:
What zip code has the Highest Percentage of Population Employed in Food Preparation & Serving in Kent, OH?
44243 has the Highest Percentage of Population Employed in Food Preparation & Serving in Kent, OH with 29.2%.
What is the Percentage of Population Employed in Food Preparation & Serving in Kent, OH?
Percentage of Population Employed in Food Preparation & Serving in Kent is 15.0%.
What is the Percentage of Population Employed in Food Preparation & Serving in Ohio?
Percentage of Population Employed in Food Preparation & Serving in Ohio is 5.6%.
What is the Percentage of Population Employed in Food Preparation & Serving in the United States?
Percentage of Population Employed in Food Preparation & Serving in the United States is 5.3%.