Zip Codes with the Highest Percentage of Population Employed in Food Preparation & Serving in Strongsville, OH
RELATED REPORTS & OPTIONS
Food Preparation & Serving
Strongsville
Compare Zip Codes
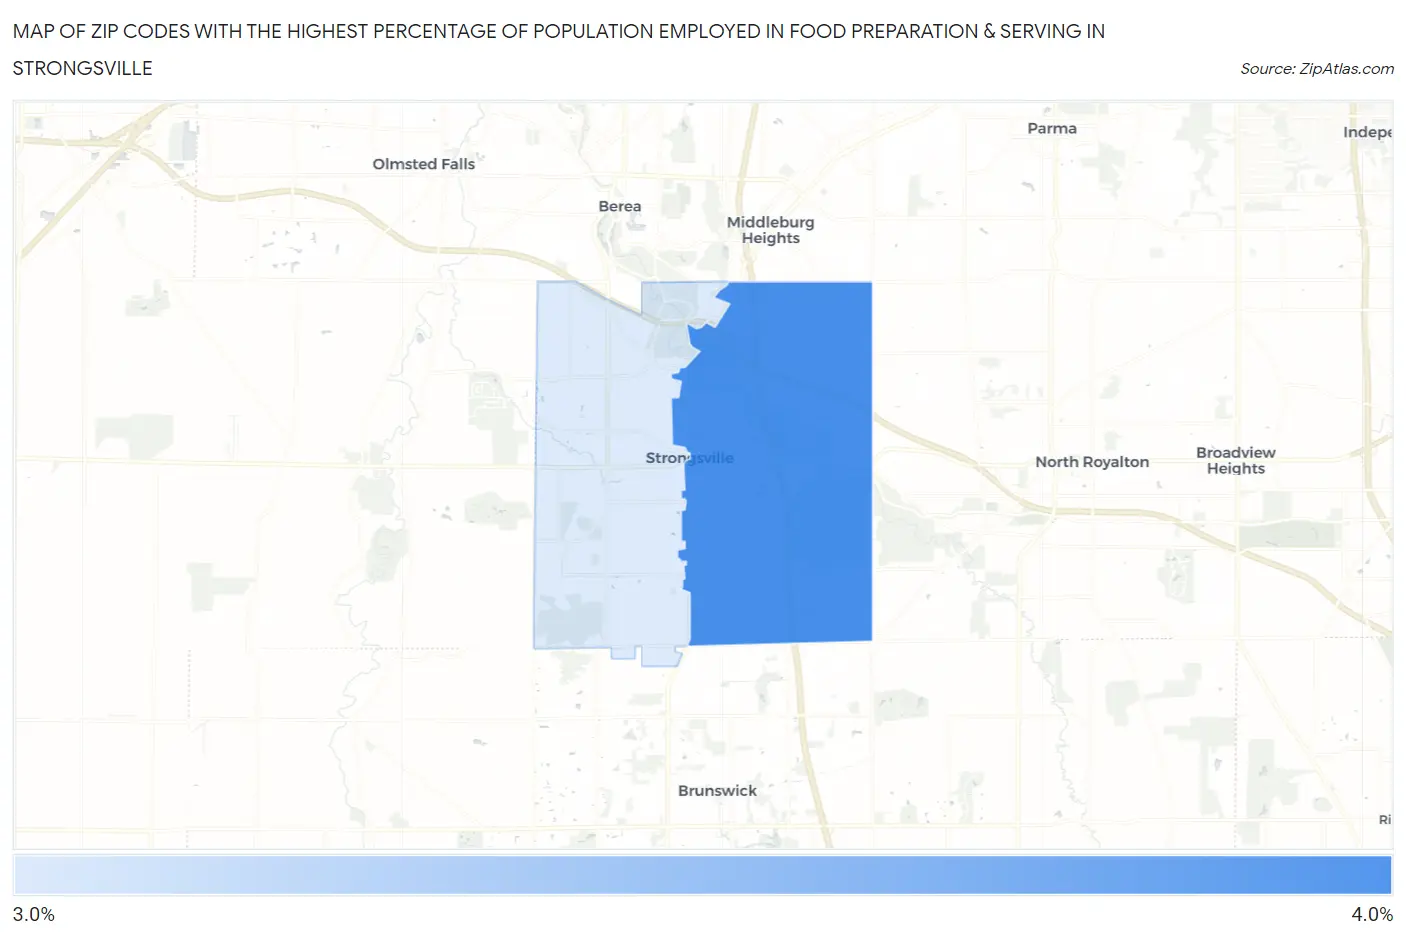
Map of Zip Codes with the Highest Percentage of Population Employed in Food Preparation & Serving in Strongsville
3.2%
3.7%
Zip Codes with the Highest Percentage of Population Employed in Food Preparation & Serving in Strongsville, OH
| Zip Code | % Employed | vs State | vs National | |
| 1. | 44136 | 3.7% | 5.6%(-1.95)#793 | 5.3%(-1.63)#18,524 |
| 2. | 44149 | 3.2% | 5.6%(-2.40)#866 | 5.3%(-2.08)#20,462 |
1
Common Questions
What are the Top Zip Codes with the Highest Percentage of Population Employed in Food Preparation & Serving in Strongsville, OH?
Top Zip Codes with the Highest Percentage of Population Employed in Food Preparation & Serving in Strongsville, OH are:
What zip code has the Highest Percentage of Population Employed in Food Preparation & Serving in Strongsville, OH?
44136 has the Highest Percentage of Population Employed in Food Preparation & Serving in Strongsville, OH with 3.7%.
What is the Percentage of Population Employed in Food Preparation & Serving in Strongsville, OH?
Percentage of Population Employed in Food Preparation & Serving in Strongsville is 3.5%.
What is the Percentage of Population Employed in Food Preparation & Serving in Ohio?
Percentage of Population Employed in Food Preparation & Serving in Ohio is 5.6%.
What is the Percentage of Population Employed in Food Preparation & Serving in the United States?
Percentage of Population Employed in Food Preparation & Serving in the United States is 5.3%.