Zip Codes with the Highest Percentage of Population Employed in Food Preparation & Serving in Lima, OH
RELATED REPORTS & OPTIONS
Food Preparation & Serving
Lima
Compare Zip Codes
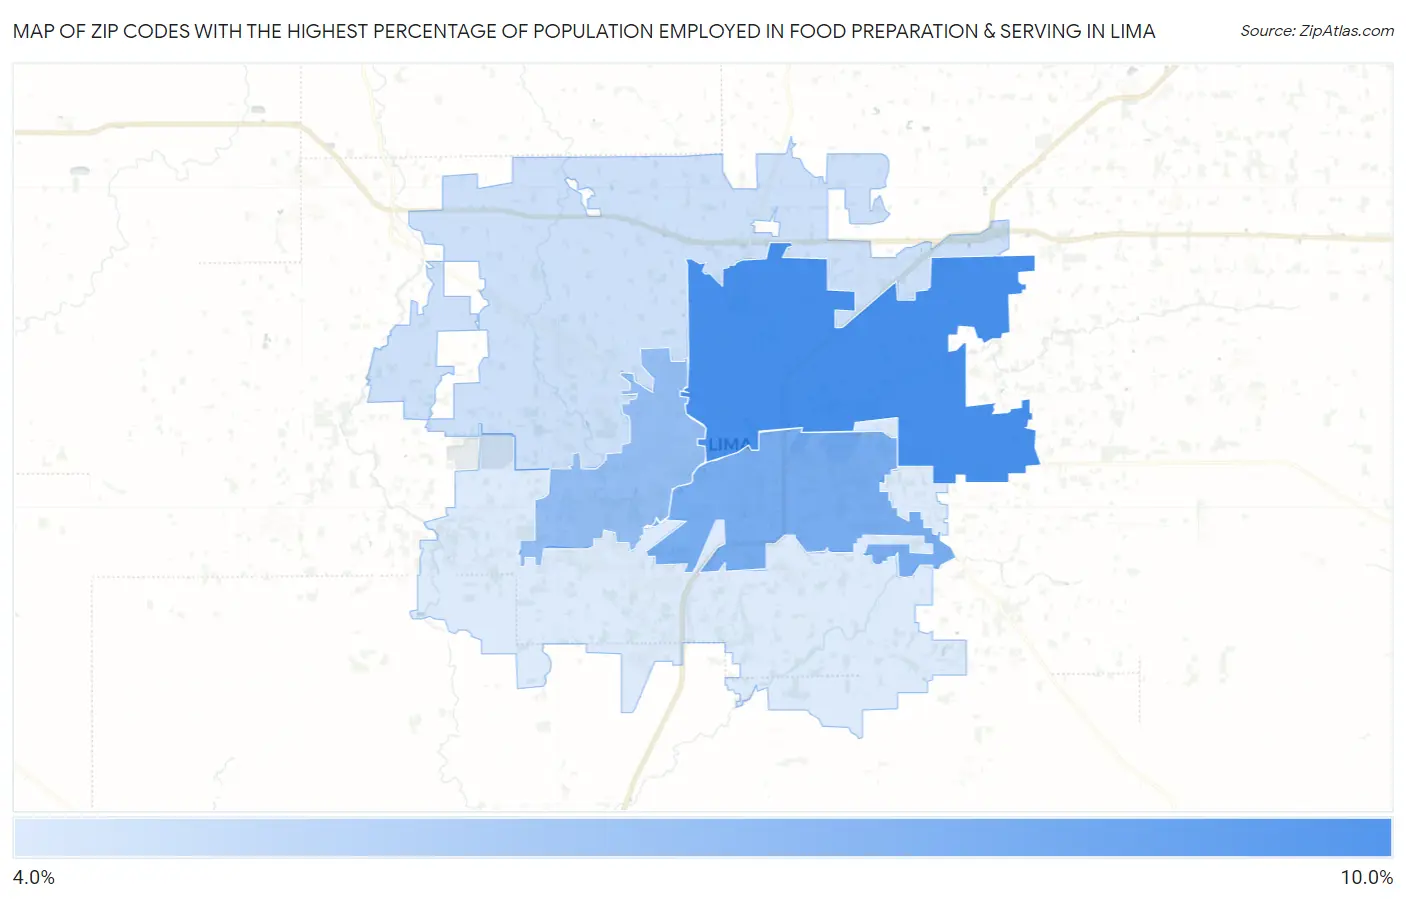
Map of Zip Codes with the Highest Percentage of Population Employed in Food Preparation & Serving in Lima
4.9%
9.6%
Zip Codes with the Highest Percentage of Population Employed in Food Preparation & Serving in Lima, OH
| Zip Code | % Employed | vs State | vs National | |
| 1. | 45801 | 9.6% | 5.6%(+3.99)#133 | 5.3%(+4.31)#2,974 |
| 2. | 45804 | 8.0% | 5.6%(+2.44)#214 | 5.3%(+2.76)#4,666 |
| 3. | 45805 | 7.1% | 5.6%(+1.54)#288 | 5.3%(+1.86)#6,231 |
| 4. | 45807 | 5.4% | 5.6%(-0.222)#499 | 5.3%(+0.098)#11,460 |
| 5. | 45806 | 4.9% | 5.6%(-0.736)#592 | 5.3%(-0.416)#13,482 |
1
Common Questions
What are the Top 3 Zip Codes with the Highest Percentage of Population Employed in Food Preparation & Serving in Lima, OH?
Top 3 Zip Codes with the Highest Percentage of Population Employed in Food Preparation & Serving in Lima, OH are:
What zip code has the Highest Percentage of Population Employed in Food Preparation & Serving in Lima, OH?
45801 has the Highest Percentage of Population Employed in Food Preparation & Serving in Lima, OH with 9.6%.
What is the Percentage of Population Employed in Food Preparation & Serving in Lima, OH?
Percentage of Population Employed in Food Preparation & Serving in Lima is 9.3%.
What is the Percentage of Population Employed in Food Preparation & Serving in Ohio?
Percentage of Population Employed in Food Preparation & Serving in Ohio is 5.6%.
What is the Percentage of Population Employed in Food Preparation & Serving in the United States?
Percentage of Population Employed in Food Preparation & Serving in the United States is 5.3%.