Zip Codes with the Highest Percentage of Population Employed in Food Preparation & Serving in Springfield, OH
RELATED REPORTS & OPTIONS
Food Preparation & Serving
Springfield
Compare Zip Codes
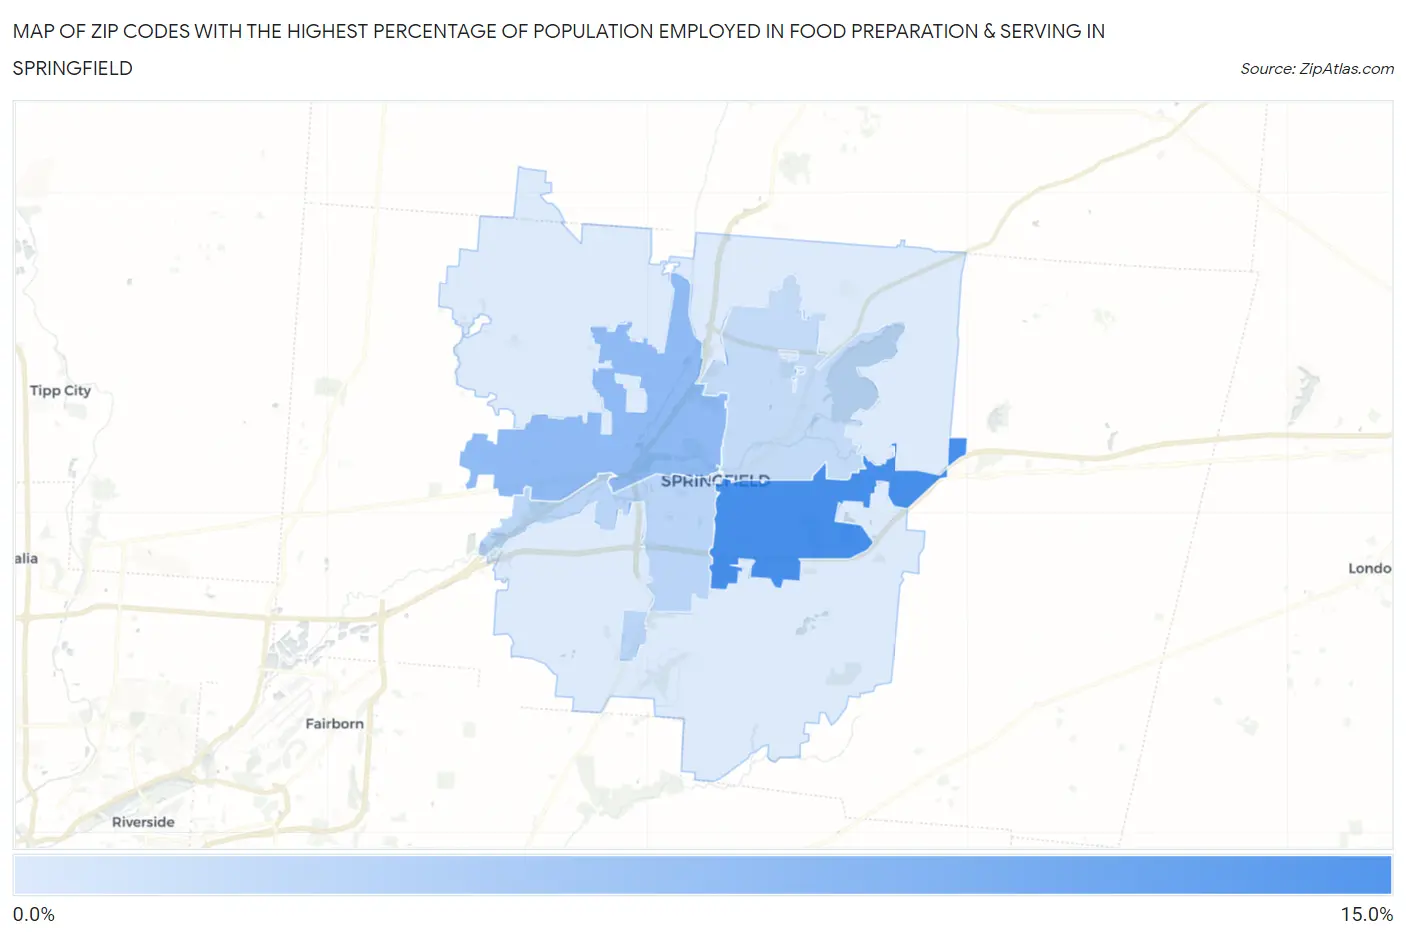
Map of Zip Codes with the Highest Percentage of Population Employed in Food Preparation & Serving in Springfield
4.3%
10.8%
Zip Codes with the Highest Percentage of Population Employed in Food Preparation & Serving in Springfield, OH
| Zip Code | % Employed | vs State | vs National | |
| 1. | 45505 | 10.8% | 5.6%(+5.19)#101 | 5.3%(+5.51)#2,158 |
| 2. | 45504 | 7.7% | 5.6%(+2.04)#242 | 5.3%(+2.36)#5,294 |
| 3. | 45506 | 5.8% | 5.6%(+0.176)#440 | 5.3%(+0.496)#10,087 |
| 4. | 45503 | 5.4% | 5.6%(-0.202)#496 | 5.3%(+0.118)#11,395 |
| 5. | 45502 | 4.3% | 5.6%(-1.27)#678 | 5.3%(-0.947)#15,703 |
1
Common Questions
What are the Top 3 Zip Codes with the Highest Percentage of Population Employed in Food Preparation & Serving in Springfield, OH?
Top 3 Zip Codes with the Highest Percentage of Population Employed in Food Preparation & Serving in Springfield, OH are:
What zip code has the Highest Percentage of Population Employed in Food Preparation & Serving in Springfield, OH?
45505 has the Highest Percentage of Population Employed in Food Preparation & Serving in Springfield, OH with 10.8%.
What is the Percentage of Population Employed in Food Preparation & Serving in Springfield, OH?
Percentage of Population Employed in Food Preparation & Serving in Springfield is 9.0%.
What is the Percentage of Population Employed in Food Preparation & Serving in Ohio?
Percentage of Population Employed in Food Preparation & Serving in Ohio is 5.6%.
What is the Percentage of Population Employed in Food Preparation & Serving in the United States?
Percentage of Population Employed in Food Preparation & Serving in the United States is 5.3%.