Zip Codes with the Highest Percentage of Population Employed in Food Preparation & Serving in Middletown, OH
RELATED REPORTS & OPTIONS
Food Preparation & Serving
Middletown
Compare Zip Codes
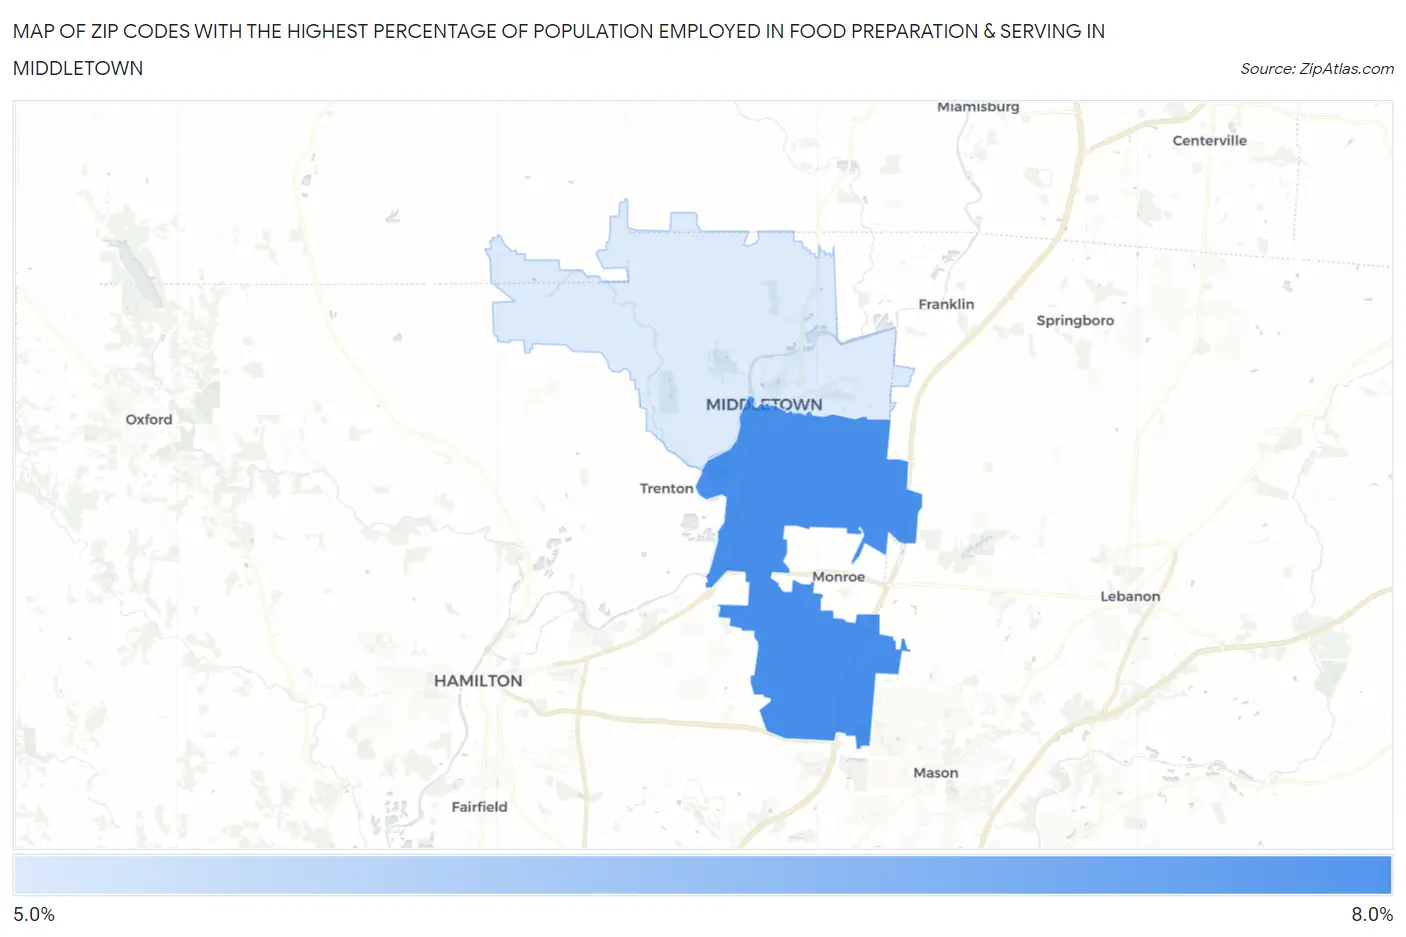
Map of Zip Codes with the Highest Percentage of Population Employed in Food Preparation & Serving in Middletown
5.6%
6.7%
Zip Codes with the Highest Percentage of Population Employed in Food Preparation & Serving in Middletown, OH
| Zip Code | % Employed | vs State | vs National | |
| 1. | 45044 | 6.7% | 5.6%(+1.05)#334 | 5.3%(+1.37)#7,461 |
| 2. | 45042 | 5.6% | 5.6%(+0.014)#463 | 5.3%(+0.334)#10,641 |
1
Common Questions
What are the Top Zip Codes with the Highest Percentage of Population Employed in Food Preparation & Serving in Middletown, OH?
Top Zip Codes with the Highest Percentage of Population Employed in Food Preparation & Serving in Middletown, OH are:
What zip code has the Highest Percentage of Population Employed in Food Preparation & Serving in Middletown, OH?
45044 has the Highest Percentage of Population Employed in Food Preparation & Serving in Middletown, OH with 6.7%.
What is the Percentage of Population Employed in Food Preparation & Serving in Middletown, OH?
Percentage of Population Employed in Food Preparation & Serving in Middletown is 7.2%.
What is the Percentage of Population Employed in Food Preparation & Serving in Ohio?
Percentage of Population Employed in Food Preparation & Serving in Ohio is 5.6%.
What is the Percentage of Population Employed in Food Preparation & Serving in the United States?
Percentage of Population Employed in Food Preparation & Serving in the United States is 5.3%.