Zip Codes with the Lowest Costs of Housing as Percentage of Income in Maryland
RELATED REPORTS & OPTIONS
Lowest Housing Costs / Income
Maryland
Compare Zip Codes
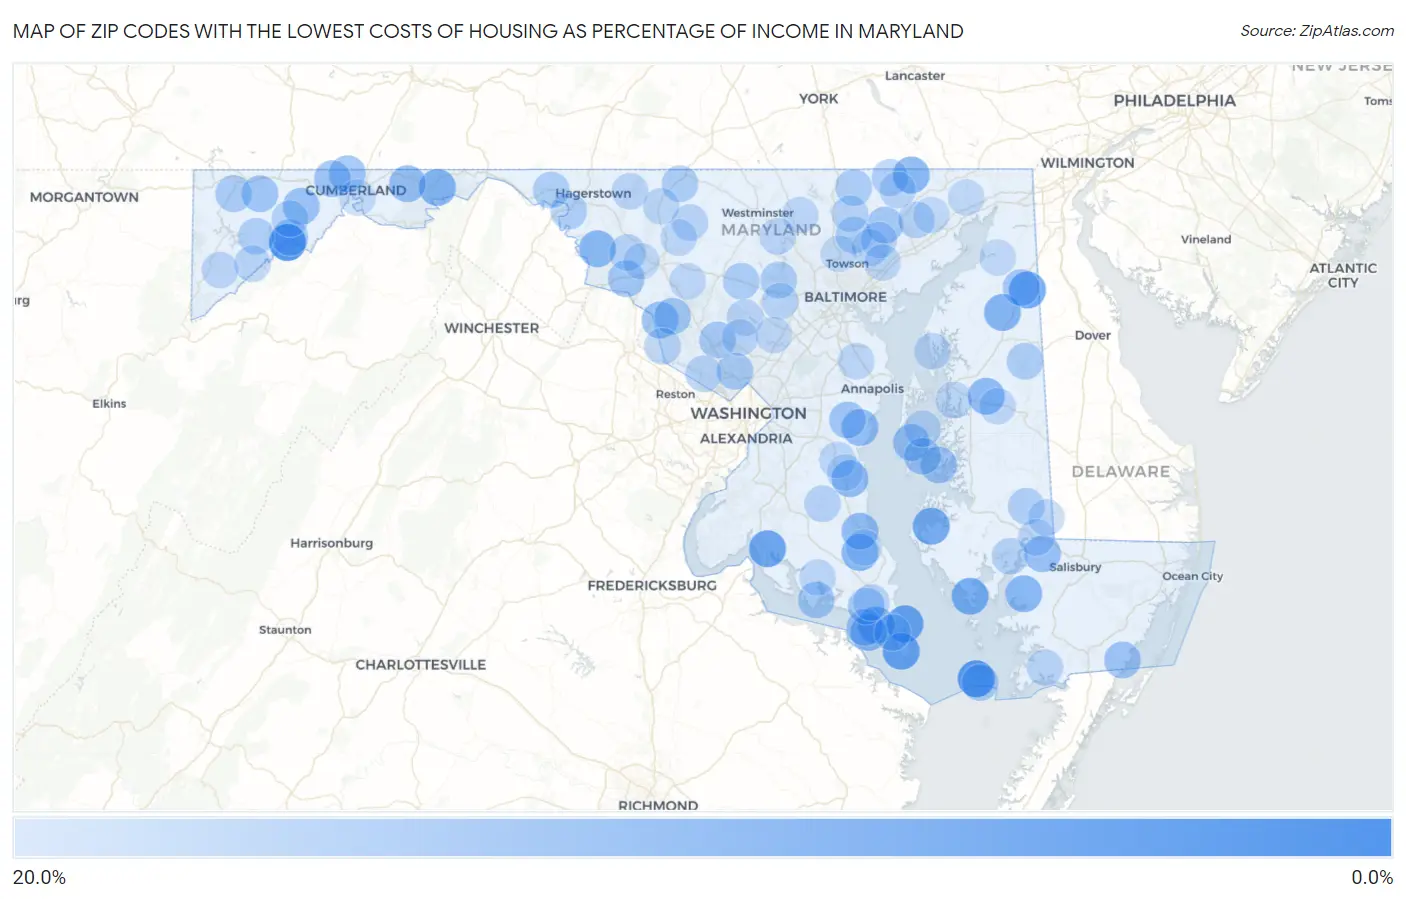
Map of Zip Codes with the Lowest Costs of Housing as Percentage of Income in Maryland
20.0%
0.0%
Zip Codes with the Lowest Costs of Housing as Percentage of Income in Maryland
| Zip Code | Housing Costs / Income | vs State | vs National | |
| 1. | 21540 | 6.2% | 20.8%(-14.6)#1 | 20.4%(-14.2)#166 |
| 2. | 21824 | 6.6% | 20.8%(-14.2)#2 | 20.4%(-13.8)#216 |
| 3. | 20628 | 8.1% | 20.8%(-12.7)#3 | 20.4%(-12.3)#548 |
| 4. | 20687 | 8.2% | 20.8%(-12.6)#4 | 20.4%(-12.2)#580 |
| 5. | 20632 | 8.7% | 20.8%(-12.1)#5 | 20.4%(-11.7)#726 |
| 6. | 21650 | 9.2% | 20.8%(-11.6)#6 | 20.4%(-11.2)#957 |
| 7. | 21648 | 9.7% | 20.8%(-11.1)#7 | 20.4%(-10.6)#1,261 |
| 8. | 21672 | 9.9% | 20.8%(-10.9)#8 | 20.4%(-10.5)#1,355 |
| 9. | 21766 | 11.0% | 20.8%(-9.81)#9 | 20.4%(-9.37)#2,266 |
| 10. | 21628 | 11.2% | 20.8%(-9.65)#10 | 20.4%(-9.20)#2,436 |
| 11. | 21865 | 11.5% | 20.8%(-9.34)#11 | 20.4%(-8.90)#2,752 |
| 12. | 21160 | 11.5% | 20.8%(-9.32)#12 | 20.4%(-8.88)#2,781 |
| 13. | 21756 | 11.5% | 20.8%(-9.31)#13 | 20.4%(-8.87)#2,788 |
| 14. | 20615 | 11.6% | 20.8%(-9.23)#14 | 20.4%(-8.79)#2,866 |
| 15. | 20630 | 11.6% | 20.8%(-9.19)#15 | 20.4%(-8.75)#2,912 |
| 16. | 20674 | 11.9% | 20.8%(-8.94)#16 | 20.4%(-8.50)#3,246 |
| 17. | 21657 | 12.1% | 20.8%(-8.71)#17 | 20.4%(-8.27)#3,562 |
| 18. | 20676 | 12.4% | 20.8%(-8.45)#18 | 20.4%(-8.01)#3,949 |
| 19. | 20689 | 12.5% | 20.8%(-8.34)#19 | 20.4%(-7.90)#4,111 |
| 20. | 20765 | 12.7% | 20.8%(-8.15)#20 | 20.4%(-7.71)#4,380 |
| 21. | 21530 | 12.9% | 20.8%(-7.94)#21 | 20.4%(-7.50)#4,702 |
| 22. | 21830 | 13.1% | 20.8%(-7.75)#22 | 20.4%(-7.31)#5,009 |
| 23. | 20842 | 13.2% | 20.8%(-7.62)#23 | 20.4%(-7.18)#5,264 |
| 24. | 21539 | 13.2% | 20.8%(-7.59)#24 | 20.4%(-7.15)#5,332 |
| 25. | 21665 | 13.2% | 20.8%(-7.58)#25 | 20.4%(-7.14)#5,335 |
| 26. | 21524 | 13.4% | 20.8%(-7.37)#26 | 20.4%(-6.93)#5,730 |
| 27. | 21545 | 13.7% | 20.8%(-7.12)#27 | 20.4%(-6.68)#6,261 |
| 28. | 20690 | 13.8% | 20.8%(-7.05)#28 | 20.4%(-6.61)#6,395 |
| 29. | 21864 | 13.8% | 20.8%(-7.03)#29 | 20.4%(-6.59)#6,443 |
| 30. | 21662 | 13.8% | 20.8%(-6.99)#30 | 20.4%(-6.55)#6,533 |
| 31. | 21536 | 13.9% | 20.8%(-6.96)#31 | 20.4%(-6.52)#6,587 |
| 32. | 20776 | 14.0% | 20.8%(-6.82)#32 | 20.4%(-6.38)#6,877 |
| 33. | 21612 | 14.1% | 20.8%(-6.76)#33 | 20.4%(-6.31)#7,034 |
| 34. | 21755 | 14.1% | 20.8%(-6.70)#34 | 20.4%(-6.25)#7,168 |
| 35. | 20838 | 14.2% | 20.8%(-6.60)#35 | 20.4%(-6.16)#7,359 |
| 36. | 21635 | 14.4% | 20.8%(-6.42)#36 | 20.4%(-5.98)#7,741 |
| 37. | 20606 | 14.5% | 20.8%(-6.35)#37 | 20.4%(-5.91)#7,922 |
| 38. | 21047 | 14.5% | 20.8%(-6.32)#38 | 20.4%(-5.88)#7,980 |
| 39. | 21866 | 14.5% | 20.8%(-6.31)#39 | 20.4%(-5.86)#8,012 |
| 40. | 20896 | 14.5% | 20.8%(-6.30)#40 | 20.4%(-5.86)#8,029 |
| 41. | 20880 | 14.6% | 20.8%(-6.25)#41 | 20.4%(-5.81)#8,139 |
| 42. | 20620 | 14.6% | 20.8%(-6.19)#42 | 20.4%(-5.75)#8,279 |
| 43. | 21562 | 14.8% | 20.8%(-6.05)#43 | 20.4%(-5.61)#8,601 |
| 44. | 21520 | 15.0% | 20.8%(-5.77)#44 | 20.4%(-5.33)#9,282 |
| 45. | 21797 | 15.2% | 20.8%(-5.62)#45 | 20.4%(-5.18)#9,681 |
| 46. | 21161 | 15.2% | 20.8%(-5.62)#46 | 20.4%(-5.18)#9,684 |
| 47. | 21104 | 15.2% | 20.8%(-5.59)#47 | 20.4%(-5.15)#9,767 |
| 48. | 20684 | 15.2% | 20.8%(-5.58)#48 | 20.4%(-5.14)#9,791 |
| 49. | 21727 | 15.3% | 20.8%(-5.55)#49 | 20.4%(-5.11)#9,865 |
| 50. | 21640 | 15.3% | 20.8%(-5.55)#50 | 20.4%(-5.11)#9,884 |
| 51. | 21131 | 15.4% | 20.8%(-5.41)#51 | 20.4%(-4.97)#10,216 |
| 52. | 21561 | 15.4% | 20.8%(-5.40)#52 | 20.4%(-4.96)#10,244 |
| 53. | 21795 | 15.6% | 20.8%(-5.23)#53 | 20.4%(-4.79)#10,662 |
| 54. | 21722 | 15.6% | 20.8%(-5.23)#54 | 20.4%(-4.79)#10,667 |
| 55. | 21132 | 15.6% | 20.8%(-5.17)#55 | 20.4%(-4.73)#10,815 |
| 56. | 21659 | 15.7% | 20.8%(-5.11)#56 | 20.4%(-4.67)#10,965 |
| 57. | 21521 | 15.9% | 20.8%(-4.96)#57 | 20.4%(-4.52)#11,357 |
| 58. | 21869 | 16.1% | 20.8%(-4.74)#58 | 20.4%(-4.30)#11,937 |
| 59. | 21769 | 16.1% | 20.8%(-4.74)#59 | 20.4%(-4.30)#11,942 |
| 60. | 20608 | 16.1% | 20.8%(-4.74)#60 | 20.4%(-4.30)#11,945 |
| 61. | 21015 | 16.1% | 20.8%(-4.68)#61 | 20.4%(-4.24)#12,089 |
| 62. | 20854 | 16.2% | 20.8%(-4.64)#62 | 20.4%(-4.20)#12,196 |
| 63. | 21111 | 16.2% | 20.8%(-4.63)#63 | 20.4%(-4.19)#12,213 |
| 64. | 20837 | 16.3% | 20.8%(-4.52)#64 | 20.4%(-4.08)#12,515 |
| 65. | 21798 | 16.3% | 20.8%(-4.52)#65 | 20.4%(-4.07)#12,519 |
| 66. | 21042 | 16.3% | 20.8%(-4.50)#66 | 20.4%(-4.06)#12,555 |
| 67. | 21624 | 16.4% | 20.8%(-4.42)#67 | 20.4%(-3.98)#12,767 |
| 68. | 21838 | 16.4% | 20.8%(-4.41)#68 | 20.4%(-3.97)#12,790 |
| 69. | 20634 | 16.4% | 20.8%(-4.41)#69 | 20.4%(-3.97)#12,794 |
| 70. | 21538 | 16.5% | 20.8%(-4.33)#70 | 20.4%(-3.89)#12,997 |
| 71. | 21048 | 16.5% | 20.8%(-4.30)#71 | 20.4%(-3.86)#13,081 |
| 72. | 21154 | 16.6% | 20.8%(-4.26)#72 | 20.4%(-3.82)#13,198 |
| 73. | 21783 | 16.6% | 20.8%(-4.25)#73 | 20.4%(-3.80)#13,223 |
| 74. | 20833 | 16.6% | 20.8%(-4.22)#74 | 20.4%(-3.78)#13,297 |
| 75. | 21837 | 16.6% | 20.8%(-4.20)#75 | 20.4%(-3.76)#13,340 |
| 76. | 21057 | 16.6% | 20.8%(-4.20)#76 | 20.4%(-3.76)#13,353 |
| 77. | 21550 | 16.6% | 20.8%(-4.18)#77 | 20.4%(-3.74)#13,393 |
| 78. | 21082 | 16.6% | 20.8%(-4.18)#78 | 20.4%(-3.74)#13,404 |
| 79. | 20832 | 16.7% | 20.8%(-4.14)#79 | 20.4%(-3.70)#13,530 |
| 80. | 21661 | 16.8% | 20.8%(-4.04)#80 | 20.4%(-3.59)#13,812 |
| 81. | 21793 | 16.8% | 20.8%(-4.02)#81 | 20.4%(-3.58)#13,846 |
| 82. | 20624 | 16.8% | 20.8%(-4.02)#82 | 20.4%(-3.58)#13,854 |
| 83. | 21146 | 16.8% | 20.8%(-3.97)#83 | 20.4%(-3.53)#13,990 |
| 84. | 21128 | 16.9% | 20.8%(-3.94)#84 | 20.4%(-3.50)#14,077 |
| 85. | 21788 | 16.9% | 20.8%(-3.91)#85 | 20.4%(-3.47)#14,154 |
| 86. | 20754 | 16.9% | 20.8%(-3.88)#86 | 20.4%(-3.44)#14,222 |
| 87. | 21658 | 16.9% | 20.8%(-3.87)#87 | 20.4%(-3.43)#14,250 |
| 88. | 21861 | 16.9% | 20.8%(-3.87)#88 | 20.4%(-3.43)#14,263 |
| 89. | 21155 | 17.0% | 20.8%(-3.82)#89 | 20.4%(-3.38)#14,375 |
| 90. | 20736 | 17.0% | 20.8%(-3.82)#90 | 20.4%(-3.38)#14,387 |
| 91. | 21754 | 17.0% | 20.8%(-3.82)#91 | 20.4%(-3.37)#14,394 |
| 92. | 21641 | 17.0% | 20.8%(-3.78)#92 | 20.4%(-3.34)#14,494 |
| 93. | 20759 | 17.1% | 20.8%(-3.68)#93 | 20.4%(-3.24)#14,709 |
| 94. | 21028 | 17.2% | 20.8%(-3.63)#94 | 20.4%(-3.19)#14,843 |
| 95. | 21093 | 17.2% | 20.8%(-3.63)#95 | 20.4%(-3.19)#14,849 |
| 96. | 21502 | 17.2% | 20.8%(-3.62)#96 | 20.4%(-3.18)#14,868 |
| 97. | 21904 | 17.2% | 20.8%(-3.62)#97 | 20.4%(-3.18)#14,886 |
| 98. | 21714 | 17.3% | 20.8%(-3.55)#98 | 20.4%(-3.11)#15,065 |
| 99. | 20685 | 17.3% | 20.8%(-3.55)#99 | 20.4%(-3.11)#15,077 |
| 100. | 21919 | 17.3% | 20.8%(-3.54)#100 | 20.4%(-3.10)#15,095 |
Common Questions
What are the Top 10 Zip Codes with the Lowest Costs of Housing as Percentage of Income in Maryland?
Top 10 Zip Codes with the Lowest Costs of Housing as Percentage of Income in Maryland are:
What zip code has the Lowest Costs of Housing as Percentage of Income in Maryland?
21540 has the Lowest Costs of Housing as Percentage of Income in Maryland with 6.2%.
What is the Average Housing Costs as Percentage of Income in the State of Maryland?
Average Housing Costs as Percentage of Income in Maryland is 20.8%.
What is the Average Housing Costs as Percentage of Income in the United States?
Average Housing Costs as Percentage of Income in the United States is 20.4%.