Zip Codes with the Highest Percentage of Households with Income Above $100,000 in Maryland
RELATED REPORTS & OPTIONS
Household Income | $100k+
Maryland
Compare Zip Codes
Map of Zip Codes with the Highest Percentage of Households with Income Above $100,000 in Maryland
60.0%
100.0%
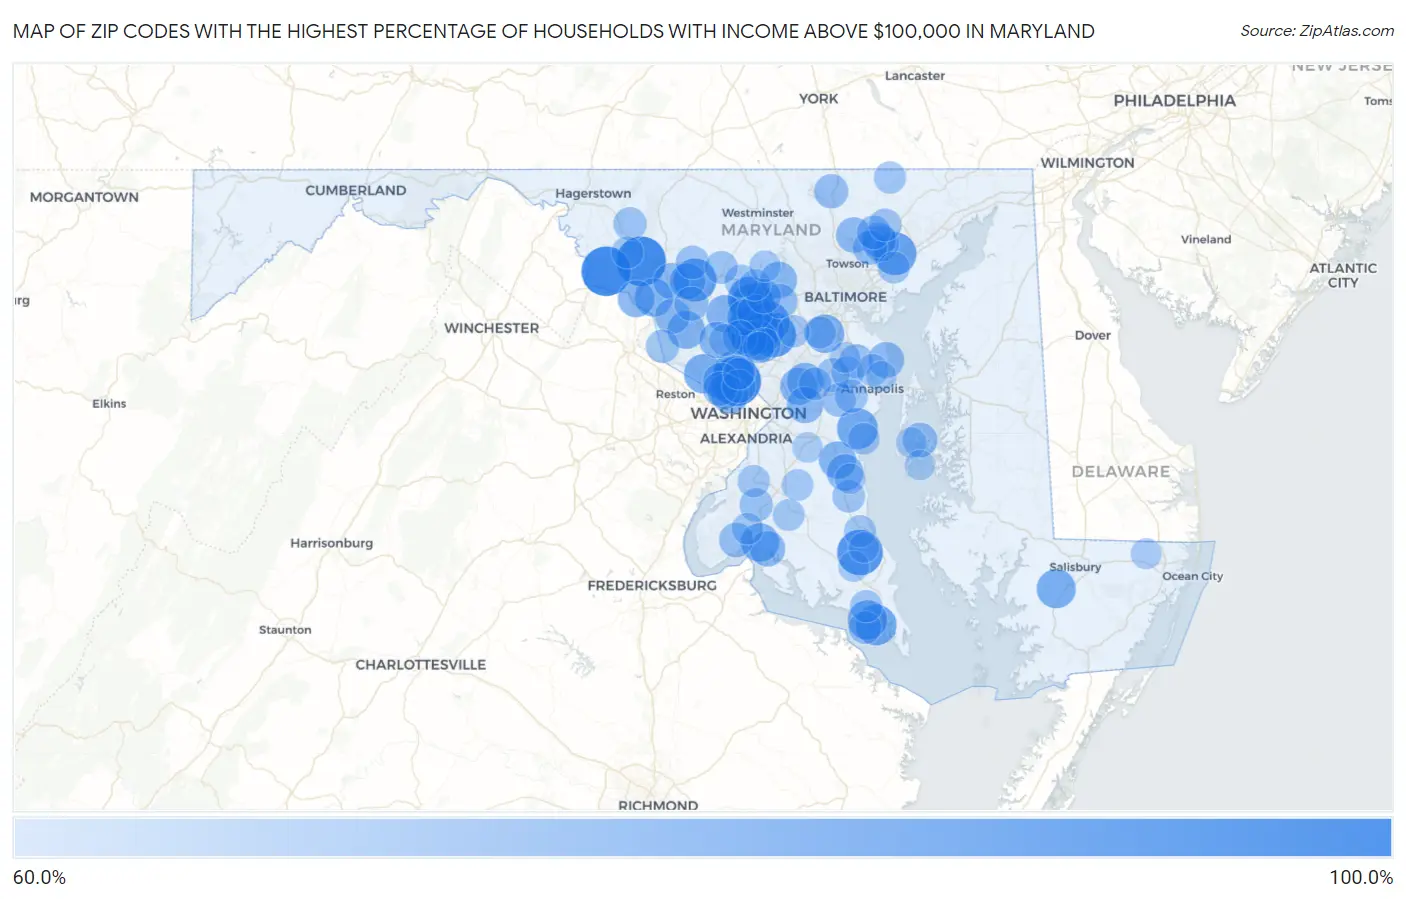
Zip Codes with the Highest Percentage of Households with Income Above $100,000 in Maryland
| Zip Code | Households with Income > $100k | vs State | vs National | |
| 1. | 21714 | 100.0% | 49.3%(+50.7)#1 | 37.3%(+62.7)#16 |
| 2. | 20862 | 100.0% | 49.3%(+50.7)#2 | 37.3%(+62.7)#17 |
| 3. | 20889 | 100.0% | 49.3%(+50.7)#3 | 37.3%(+62.7)#32 |
| 4. | 21715 | 100.0% | 49.3%(+50.7)#4 | 37.3%(+62.7)#136 |
| 5. | 20615 | 93.2% | 49.3%(+43.9)#5 | 37.3%(+55.9)#159 |
| 6. | 21737 | 91.7% | 49.3%(+42.4)#6 | 37.3%(+54.4)#164 |
| 7. | 20759 | 91.2% | 49.3%(+41.9)#7 | 37.3%(+53.9)#165 |
| 8. | 21738 | 90.6% | 49.3%(+41.3)#8 | 37.3%(+53.3)#172 |
| 9. | 21770 | 88.3% | 49.3%(+39.0)#9 | 37.3%(+51.0)#192 |
| 10. | 21156 | 88.1% | 49.3%(+38.8)#10 | 37.3%(+50.8)#194 |
| 11. | 21029 | 86.9% | 49.3%(+37.6)#11 | 37.3%(+49.6)#204 |
| 12. | 20896 | 85.5% | 49.3%(+36.2)#12 | 37.3%(+48.2)#223 |
| 13. | 20777 | 85.2% | 49.3%(+35.9)#13 | 37.3%(+47.9)#227 |
| 14. | 20778 | 84.7% | 49.3%(+35.4)#14 | 37.3%(+47.4)#235 |
| 15. | 20630 | 84.3% | 49.3%(+35.0)#15 | 37.3%(+47.0)#239 |
| 16. | 20861 | 83.2% | 49.3%(+33.9)#16 | 37.3%(+45.9)#261 |
| 17. | 20692 | 82.4% | 49.3%(+33.1)#17 | 37.3%(+45.1)#273 |
| 18. | 20854 | 82.1% | 49.3%(+32.8)#18 | 37.3%(+44.8)#276 |
| 19. | 21810 | 81.5% | 49.3%(+32.2)#19 | 37.3%(+44.2)#294 |
| 20. | 20611 | 80.5% | 49.3%(+31.2)#20 | 37.3%(+43.2)#329 |
| 21. | 21077 | 80.4% | 49.3%(+31.1)#21 | 37.3%(+43.1)#332 |
| 22. | 21710 | 79.9% | 49.3%(+30.6)#22 | 37.3%(+42.6)#349 |
| 23. | 20841 | 79.2% | 49.3%(+29.9)#23 | 37.3%(+41.9)#372 |
| 24. | 20882 | 78.7% | 49.3%(+29.4)#24 | 37.3%(+41.4)#391 |
| 25. | 20754 | 78.3% | 49.3%(+29.0)#25 | 37.3%(+41.0)#407 |
| 26. | 20816 | 78.2% | 49.3%(+28.9)#26 | 37.3%(+40.9)#412 |
| 27. | 20769 | 78.0% | 49.3%(+28.7)#27 | 37.3%(+40.7)#422 |
| 28. | 20817 | 77.9% | 49.3%(+28.6)#28 | 37.3%(+40.6)#424 |
| 29. | 20720 | 77.6% | 49.3%(+28.3)#29 | 37.3%(+40.3)#436 |
| 30. | 21777 | 77.6% | 49.3%(+28.3)#30 | 37.3%(+40.3)#438 |
| 31. | 20736 | 77.3% | 49.3%(+28.0)#31 | 37.3%(+40.0)#450 |
| 32. | 21104 | 77.2% | 49.3%(+27.9)#32 | 37.3%(+39.9)#458 |
| 33. | 20880 | 77.2% | 49.3%(+27.9)#33 | 37.3%(+39.9)#460 |
| 34. | 20721 | 76.7% | 49.3%(+27.4)#34 | 37.3%(+39.4)#479 |
| 35. | 20860 | 76.7% | 49.3%(+27.4)#35 | 37.3%(+39.4)#484 |
| 36. | 20833 | 76.2% | 49.3%(+26.9)#36 | 37.3%(+38.9)#512 |
| 37. | 21704 | 76.1% | 49.3%(+26.8)#37 | 37.3%(+38.8)#515 |
| 38. | 21754 | 76.1% | 49.3%(+26.8)#38 | 37.3%(+38.8)#517 |
| 39. | 21056 | 75.9% | 49.3%(+26.6)#39 | 37.3%(+38.6)#527 |
| 40. | 21036 | 75.7% | 49.3%(+26.4)#40 | 37.3%(+38.4)#535 |
| 41. | 21051 | 75.6% | 49.3%(+26.3)#41 | 37.3%(+38.3)#543 |
| 42. | 20632 | 75.4% | 49.3%(+26.1)#42 | 37.3%(+38.1)#556 |
| 43. | 20838 | 75.2% | 49.3%(+25.9)#43 | 37.3%(+37.9)#568 |
| 44. | 21131 | 75.0% | 49.3%(+25.7)#44 | 37.3%(+37.7)#573 |
| 45. | 20812 | 74.7% | 49.3%(+25.4)#45 | 37.3%(+37.4)#593 |
| 46. | 21082 | 74.1% | 49.3%(+24.8)#46 | 37.3%(+36.8)#630 |
| 47. | 21042 | 73.9% | 49.3%(+24.6)#47 | 37.3%(+36.6)#640 |
| 48. | 21794 | 73.7% | 49.3%(+24.4)#48 | 37.3%(+36.4)#661 |
| 49. | 21647 | 73.7% | 49.3%(+24.4)#49 | 37.3%(+36.4)#663 |
| 50. | 20832 | 73.6% | 49.3%(+24.3)#50 | 37.3%(+36.3)#666 |
| 51. | 21057 | 73.5% | 49.3%(+24.2)#51 | 37.3%(+36.2)#672 |
| 52. | 20693 | 73.3% | 49.3%(+24.0)#52 | 37.3%(+36.0)#683 |
| 53. | 20818 | 73.2% | 49.3%(+23.9)#53 | 37.3%(+35.9)#690 |
| 54. | 21120 | 73.0% | 49.3%(+23.7)#54 | 37.3%(+35.7)#704 |
| 55. | 20868 | 73.0% | 49.3%(+23.7)#55 | 37.3%(+35.7)#705 |
| 56. | 20871 | 72.9% | 49.3%(+23.6)#56 | 37.3%(+35.6)#710 |
| 57. | 21146 | 72.7% | 49.3%(+23.4)#57 | 37.3%(+35.4)#723 |
| 58. | 21013 | 72.3% | 49.3%(+23.0)#58 | 37.3%(+35.0)#755 |
| 59. | 21774 | 72.0% | 49.3%(+22.7)#59 | 37.3%(+34.7)#774 |
| 60. | 20815 | 71.9% | 49.3%(+22.6)#60 | 37.3%(+34.6)#782 |
| 61. | 21054 | 71.8% | 49.3%(+22.5)#61 | 37.3%(+34.5)#794 |
| 62. | 21035 | 71.8% | 49.3%(+22.5)#62 | 37.3%(+34.5)#795 |
| 63. | 20675 | 71.6% | 49.3%(+22.3)#63 | 37.3%(+34.3)#817 |
| 64. | 20837 | 71.5% | 49.3%(+22.2)#64 | 37.3%(+34.2)#825 |
| 65. | 21773 | 71.3% | 49.3%(+22.0)#65 | 37.3%(+34.0)#843 |
| 66. | 21797 | 71.1% | 49.3%(+21.8)#66 | 37.3%(+33.8)#864 |
| 67. | 21140 | 71.0% | 49.3%(+21.7)#67 | 37.3%(+33.7)#874 |
| 68. | 21771 | 70.8% | 49.3%(+21.5)#68 | 37.3%(+33.5)#888 |
| 69. | 21047 | 70.6% | 49.3%(+21.3)#69 | 37.3%(+33.3)#907 |
| 70. | 20690 | 70.6% | 49.3%(+21.3)#70 | 37.3%(+33.3)#914 |
| 71. | 20639 | 70.5% | 49.3%(+21.2)#71 | 37.3%(+33.2)#918 |
| 72. | 20715 | 70.4% | 49.3%(+21.1)#72 | 37.3%(+33.1)#922 |
| 73. | 21032 | 69.9% | 49.3%(+20.6)#73 | 37.3%(+32.6)#978 |
| 74. | 20620 | 69.8% | 49.3%(+20.5)#74 | 37.3%(+32.5)#991 |
| 75. | 20607 | 69.7% | 49.3%(+20.4)#75 | 37.3%(+32.4)#996 |
| 76. | 21076 | 69.5% | 49.3%(+20.2)#76 | 37.3%(+32.2)#1,010 |
| 77. | 21132 | 69.5% | 49.3%(+20.2)#77 | 37.3%(+32.2)#1,013 |
| 78. | 21012 | 69.3% | 49.3%(+20.0)#78 | 37.3%(+32.0)#1,024 |
| 79. | 21046 | 69.3% | 49.3%(+20.0)#79 | 37.3%(+32.0)#1,026 |
| 80. | 21769 | 69.3% | 49.3%(+20.0)#80 | 37.3%(+32.0)#1,029 |
| 81. | 21162 | 69.3% | 49.3%(+20.0)#81 | 37.3%(+32.0)#1,032 |
| 82. | 20676 | 69.3% | 49.3%(+20.0)#82 | 37.3%(+32.0)#1,033 |
| 83. | 20677 | 69.0% | 49.3%(+19.7)#83 | 37.3%(+31.7)#1,063 |
| 84. | 20855 | 68.9% | 49.3%(+19.6)#84 | 37.3%(+31.6)#1,070 |
| 85. | 20733 | 68.7% | 49.3%(+19.4)#85 | 37.3%(+31.4)#1,086 |
| 86. | 20617 | 68.7% | 49.3%(+19.4)#86 | 37.3%(+31.4)#1,090 |
| 87. | 20613 | 68.6% | 49.3%(+19.3)#87 | 37.3%(+31.3)#1,097 |
| 88. | 20895 | 68.5% | 49.3%(+19.2)#88 | 37.3%(+31.2)#1,108 |
| 89. | 21723 | 68.3% | 49.3%(+19.0)#89 | 37.3%(+31.0)#1,135 |
| 90. | 21784 | 68.2% | 49.3%(+18.9)#90 | 37.3%(+30.9)#1,137 |
| 91. | 20905 | 68.0% | 49.3%(+18.7)#91 | 37.3%(+30.7)#1,162 |
| 92. | 20636 | 67.4% | 49.3%(+18.1)#92 | 37.3%(+30.1)#1,230 |
| 93. | 21872 | 67.3% | 49.3%(+18.0)#93 | 37.3%(+30.0)#1,240 |
| 94. | 21108 | 67.1% | 49.3%(+17.8)#94 | 37.3%(+29.8)#1,251 |
| 95. | 20685 | 66.9% | 49.3%(+17.6)#95 | 37.3%(+29.6)#1,285 |
| 96. | 20689 | 66.9% | 49.3%(+17.6)#96 | 37.3%(+29.6)#1,287 |
| 97. | 21665 | 66.6% | 49.3%(+17.3)#97 | 37.3%(+29.3)#1,335 |
| 98. | 20772 | 66.5% | 49.3%(+17.2)#98 | 37.3%(+29.2)#1,337 |
| 99. | 21409 | 66.3% | 49.3%(+17.0)#99 | 37.3%(+29.0)#1,361 |
| 100. | 21652 | 66.3% | 49.3%(+17.0)#100 | 37.3%(+29.0)#1,372 |
Common Questions
What are the Top 10 Zip Codes with the Highest Percentage of Households with Income Above $100,000 in Maryland?
Top 10 Zip Codes with the Highest Percentage of Households with Income Above $100,000 in Maryland are:
What zip code has the Highest Percentage of Households with Income Above $100,000 in Maryland?
21714 has the Highest Percentage of Households with Income Above $100,000 in Maryland with 100.0%.
What is the Percentage of Households with Income Above $100,000 in the State of Maryland?
Percentage of Households with Income Above $100,000 in Maryland is 49.3%.
What is the Percentage of Households with Income Above $100,000 in the United States?
Percentage of Households with Income Above $100,000 in the United States is 37.3%.