Zip Codes with the Highest Percentage of Families with Income Above $100,000 in Maryland
RELATED REPORTS & OPTIONS
Family Income | $100k+
Maryland
Compare Zip Codes
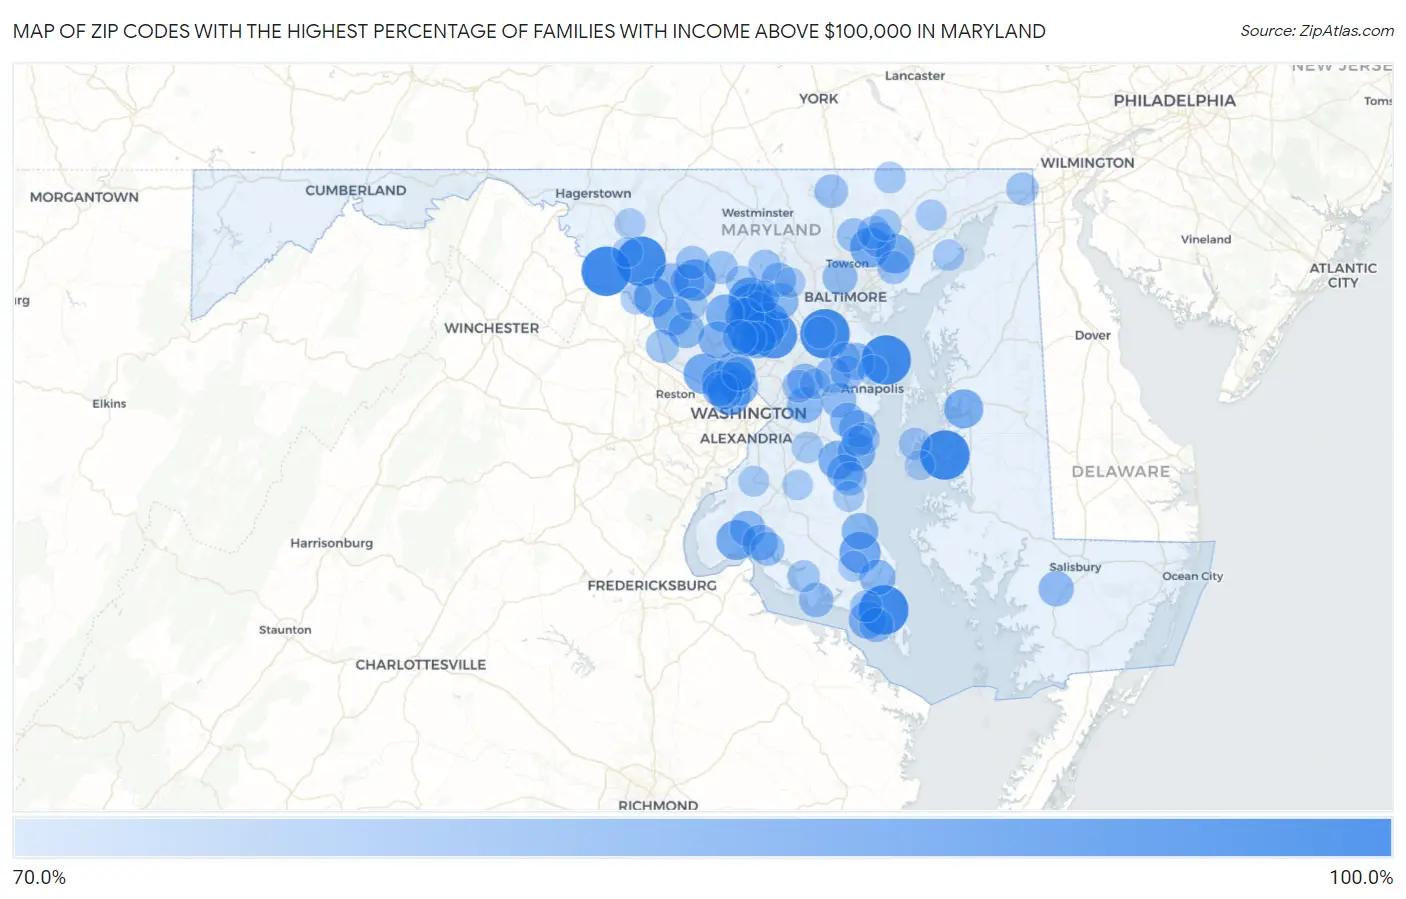
Map of Zip Codes with the Highest Percentage of Families with Income Above $100,000 in Maryland
70.0%
100.0%
Zip Codes with the Highest Percentage of Families with Income Above $100,000 in Maryland
| Zip Code | Families with Income > $100k | vs State | vs National | |
| 1. | 21056 | 100.0% | 59.4%(+40.6)#1 | 46.1%(+53.9)#31 |
| 2. | 21714 | 100.0% | 59.4%(+40.6)#2 | 46.1%(+53.9)#40 |
| 3. | 20862 | 100.0% | 59.4%(+40.6)#3 | 46.1%(+53.9)#42 |
| 4. | 20667 | 100.0% | 59.4%(+40.6)#4 | 46.1%(+53.9)#83 |
| 5. | 21077 | 100.0% | 59.4%(+40.6)#5 | 46.1%(+53.9)#126 |
| 6. | 21653 | 100.0% | 59.4%(+40.6)#6 | 46.1%(+53.9)#127 |
| 7. | 21715 | 100.0% | 59.4%(+40.6)#7 | 46.1%(+53.9)#259 |
| 8. | 20759 | 96.6% | 59.4%(+37.2)#8 | 46.1%(+50.5)#279 |
| 9. | 21737 | 94.4% | 59.4%(+35.0)#9 | 46.1%(+48.3)#296 |
| 10. | 21738 | 91.0% | 59.4%(+31.6)#10 | 46.1%(+44.9)#339 |
| 11. | 21036 | 91.0% | 59.4%(+31.6)#11 | 46.1%(+44.9)#340 |
| 12. | 21770 | 89.2% | 59.4%(+29.8)#12 | 46.1%(+43.1)#388 |
| 13. | 20615 | 89.2% | 59.4%(+29.8)#13 | 46.1%(+43.1)#389 |
| 14. | 20816 | 88.3% | 59.4%(+28.9)#14 | 46.1%(+42.2)#411 |
| 15. | 21029 | 88.0% | 59.4%(+28.6)#15 | 46.1%(+41.9)#425 |
| 16. | 20777 | 88.0% | 59.4%(+28.6)#16 | 46.1%(+41.9)#428 |
| 17. | 20854 | 87.9% | 59.4%(+28.5)#17 | 46.1%(+41.8)#430 |
| 18. | 20693 | 87.5% | 59.4%(+28.1)#18 | 46.1%(+41.4)#453 |
| 19. | 21057 | 87.4% | 59.4%(+28.0)#19 | 46.1%(+41.3)#459 |
| 20. | 20817 | 87.3% | 59.4%(+27.9)#20 | 46.1%(+41.2)#461 |
| 21. | 21710 | 87.1% | 59.4%(+27.7)#21 | 46.1%(+41.0)#472 |
| 22. | 20896 | 87.0% | 59.4%(+27.6)#22 | 46.1%(+40.9)#476 |
| 23. | 21156 | 86.8% | 59.4%(+27.4)#23 | 46.1%(+40.7)#483 |
| 24. | 20838 | 86.6% | 59.4%(+27.2)#24 | 46.1%(+40.5)#496 |
| 25. | 20833 | 86.3% | 59.4%(+26.9)#25 | 46.1%(+40.2)#510 |
| 26. | 21679 | 86.3% | 59.4%(+26.9)#26 | 46.1%(+40.2)#514 |
| 27. | 20815 | 86.0% | 59.4%(+26.6)#27 | 46.1%(+39.9)#530 |
| 28. | 20754 | 85.4% | 59.4%(+26.0)#28 | 46.1%(+39.3)#568 |
| 29. | 20882 | 85.3% | 59.4%(+25.9)#29 | 46.1%(+39.2)#575 |
| 30. | 20779 | 84.8% | 59.4%(+25.4)#30 | 46.1%(+38.7)#608 |
| 31. | 20692 | 84.4% | 59.4%(+25.0)#31 | 46.1%(+38.3)#640 |
| 32. | 20880 | 84.3% | 59.4%(+24.9)#32 | 46.1%(+38.2)#647 |
| 33. | 20778 | 83.7% | 59.4%(+24.3)#33 | 46.1%(+37.6)#695 |
| 34. | 20861 | 83.5% | 59.4%(+24.1)#34 | 46.1%(+37.4)#706 |
| 35. | 21146 | 83.2% | 59.4%(+23.8)#35 | 46.1%(+37.1)#725 |
| 36. | 20676 | 83.1% | 59.4%(+23.7)#36 | 46.1%(+37.0)#734 |
| 37. | 21042 | 83.0% | 59.4%(+23.6)#37 | 46.1%(+36.9)#738 |
| 38. | 20814 | 82.8% | 59.4%(+23.4)#38 | 46.1%(+36.7)#746 |
| 39. | 20841 | 82.6% | 59.4%(+23.2)#39 | 46.1%(+36.5)#766 |
| 40. | 20736 | 82.6% | 59.4%(+23.2)#40 | 46.1%(+36.5)#767 |
| 41. | 20721 | 82.3% | 59.4%(+22.9)#41 | 46.1%(+36.2)#786 |
| 42. | 20688 | 82.3% | 59.4%(+22.9)#42 | 46.1%(+36.2)#791 |
| 43. | 20812 | 82.3% | 59.4%(+22.9)#43 | 46.1%(+36.2)#793 |
| 44. | 20677 | 82.1% | 59.4%(+22.7)#44 | 46.1%(+36.0)#801 |
| 45. | 20818 | 82.0% | 59.4%(+22.6)#45 | 46.1%(+35.9)#807 |
| 46. | 20611 | 82.0% | 59.4%(+22.6)#46 | 46.1%(+35.9)#808 |
| 47. | 20860 | 81.6% | 59.4%(+22.2)#47 | 46.1%(+35.5)#856 |
| 48. | 21704 | 81.5% | 59.4%(+22.1)#48 | 46.1%(+35.4)#860 |
| 49. | 21810 | 81.5% | 59.4%(+22.1)#49 | 46.1%(+35.4)#867 |
| 50. | 20720 | 81.4% | 59.4%(+22.0)#50 | 46.1%(+35.3)#868 |
| 51. | 21054 | 81.4% | 59.4%(+22.0)#51 | 46.1%(+35.3)#870 |
| 52. | 21035 | 81.1% | 59.4%(+21.7)#52 | 46.1%(+35.0)#908 |
| 53. | 21210 | 80.9% | 59.4%(+21.5)#53 | 46.1%(+34.8)#923 |
| 54. | 20832 | 80.8% | 59.4%(+21.4)#54 | 46.1%(+34.7)#934 |
| 55. | 20776 | 80.8% | 59.4%(+21.4)#55 | 46.1%(+34.7)#944 |
| 56. | 21082 | 80.8% | 59.4%(+21.4)#56 | 46.1%(+34.7)#945 |
| 57. | 21754 | 80.6% | 59.4%(+21.2)#57 | 46.1%(+34.5)#966 |
| 58. | 21104 | 80.6% | 59.4%(+21.2)#58 | 46.1%(+34.5)#967 |
| 59. | 20606 | 80.4% | 59.4%(+21.0)#59 | 46.1%(+34.3)#985 |
| 60. | 20630 | 80.2% | 59.4%(+20.8)#60 | 46.1%(+34.1)#1,014 |
| 61. | 20895 | 80.0% | 59.4%(+20.6)#61 | 46.1%(+33.9)#1,025 |
| 62. | 20632 | 80.0% | 59.4%(+20.6)#62 | 46.1%(+33.9)#1,033 |
| 63. | 21032 | 79.4% | 59.4%(+20.0)#63 | 46.1%(+33.3)#1,093 |
| 64. | 21120 | 79.3% | 59.4%(+19.9)#64 | 46.1%(+33.2)#1,109 |
| 65. | 20689 | 79.3% | 59.4%(+19.9)#65 | 46.1%(+33.2)#1,110 |
| 66. | 21131 | 79.2% | 59.4%(+19.8)#66 | 46.1%(+33.1)#1,118 |
| 67. | 21774 | 78.9% | 59.4%(+19.5)#67 | 46.1%(+32.8)#1,154 |
| 68. | 20837 | 78.7% | 59.4%(+19.3)#68 | 46.1%(+32.6)#1,176 |
| 69. | 21784 | 78.6% | 59.4%(+19.2)#69 | 46.1%(+32.5)#1,182 |
| 70. | 21771 | 78.6% | 59.4%(+19.2)#70 | 46.1%(+32.5)#1,184 |
| 71. | 20769 | 78.6% | 59.4%(+19.2)#71 | 46.1%(+32.5)#1,189 |
| 72. | 21013 | 78.6% | 59.4%(+19.2)#72 | 46.1%(+32.5)#1,190 |
| 73. | 21162 | 78.6% | 59.4%(+19.2)#73 | 46.1%(+32.5)#1,192 |
| 74. | 21920 | 77.9% | 59.4%(+18.5)#74 | 46.1%(+31.8)#1,279 |
| 75. | 20871 | 77.6% | 59.4%(+18.2)#75 | 46.1%(+31.5)#1,320 |
| 76. | 20733 | 77.5% | 59.4%(+18.1)#76 | 46.1%(+31.4)#1,344 |
| 77. | 21676 | 77.5% | 59.4%(+18.1)#77 | 46.1%(+31.4)#1,347 |
| 78. | 21076 | 77.4% | 59.4%(+18.0)#78 | 46.1%(+31.3)#1,351 |
| 79. | 20620 | 77.3% | 59.4%(+17.9)#79 | 46.1%(+31.2)#1,368 |
| 80. | 20621 | 77.3% | 59.4%(+17.9)#80 | 46.1%(+31.2)#1,369 |
| 81. | 21047 | 77.1% | 59.4%(+17.7)#81 | 46.1%(+31.0)#1,392 |
| 82. | 21794 | 77.1% | 59.4%(+17.7)#82 | 46.1%(+31.0)#1,396 |
| 83. | 20772 | 76.7% | 59.4%(+17.3)#83 | 46.1%(+30.6)#1,447 |
| 84. | 21132 | 76.7% | 59.4%(+17.3)#84 | 46.1%(+30.6)#1,462 |
| 85. | 21005 | 76.4% | 59.4%(+17.0)#85 | 46.1%(+30.3)#1,493 |
| 86. | 21777 | 76.3% | 59.4%(+16.9)#86 | 46.1%(+30.2)#1,513 |
| 87. | 20751 | 76.3% | 59.4%(+16.9)#87 | 46.1%(+30.2)#1,514 |
| 88. | 21797 | 76.2% | 59.4%(+16.8)#88 | 46.1%(+30.1)#1,533 |
| 89. | 21028 | 76.0% | 59.4%(+16.6)#89 | 46.1%(+29.9)#1,566 |
| 90. | 20639 | 75.9% | 59.4%(+16.5)#90 | 46.1%(+29.8)#1,577 |
| 91. | 20607 | 75.8% | 59.4%(+16.4)#91 | 46.1%(+29.7)#1,588 |
| 92. | 20636 | 75.7% | 59.4%(+16.3)#92 | 46.1%(+29.6)#1,604 |
| 93. | 20715 | 75.6% | 59.4%(+16.2)#93 | 46.1%(+29.5)#1,612 |
| 94. | 21773 | 75.6% | 59.4%(+16.2)#94 | 46.1%(+29.5)#1,614 |
| 95. | 20613 | 75.5% | 59.4%(+16.1)#95 | 46.1%(+29.4)#1,626 |
| 96. | 21108 | 75.3% | 59.4%(+15.9)#96 | 46.1%(+29.2)#1,657 |
| 97. | 21769 | 75.3% | 59.4%(+15.9)#97 | 46.1%(+29.2)#1,661 |
| 98. | 21163 | 75.3% | 59.4%(+15.9)#98 | 46.1%(+29.2)#1,666 |
| 99. | 21012 | 75.1% | 59.4%(+15.7)#99 | 46.1%(+29.0)#1,689 |
| 100. | 21652 | 75.0% | 59.4%(+15.6)#100 | 46.1%(+28.9)#1,711 |
Common Questions
What are the Top 10 Zip Codes with the Highest Percentage of Families with Income Above $100,000 in Maryland?
Top 10 Zip Codes with the Highest Percentage of Families with Income Above $100,000 in Maryland are:
What zip code has the Highest Percentage of Families with Income Above $100,000 in Maryland?
21056 has the Highest Percentage of Families with Income Above $100,000 in Maryland with 100.0%.
What is the Percentage of Families with Income Above $100,000 in the State of Maryland?
Percentage of Families with Income Above $100,000 in Maryland is 59.4%.
What is the Percentage of Families with Income Above $100,000 in the United States?
Percentage of Families with Income Above $100,000 in the United States is 46.1%.