Zip Codes with the Highest Percentage of Black / African American Population in Maryland
RELATED REPORTS & OPTIONS
Black / African American
Maryland
Compare Zip Codes
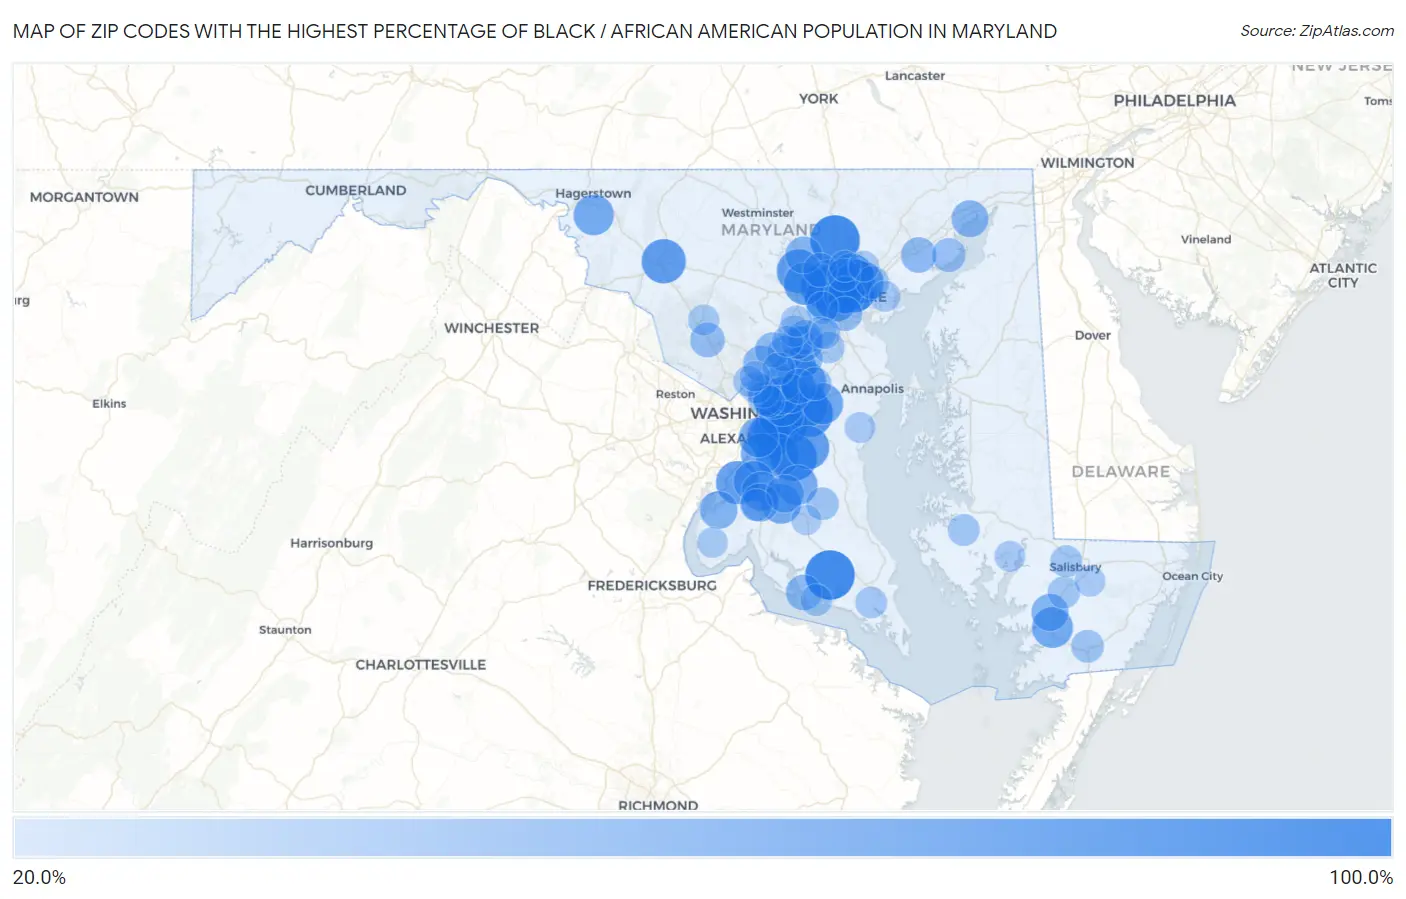
Map of Zip Codes with the Highest Percentage of Black / African American Population in Maryland
20.0%
100.0%
Zip Codes with the Highest Percentage of Black / African American Population in Maryland
| Zip Code | Black / African American | vs State | vs National | |
| 1. | 20656 | 100.0% | 29.9%(+70.1)#1 | 12.5%(+87.5)#7 |
| 2. | 21031 | 100.0% | 29.9%(+70.1)#2 | 12.5%(+87.5)#33 |
| 3. | 21216 | 93.2% | 29.9%(+63.3)#3 | 12.5%(+80.7)#101 |
| 4. | 20623 | 89.1% | 29.9%(+59.2)#4 | 12.5%(+76.7)#162 |
| 5. | 21213 | 87.6% | 29.9%(+57.7)#5 | 12.5%(+75.2)#193 |
| 6. | 20747 | 86.7% | 29.9%(+56.8)#6 | 12.5%(+74.2)#211 |
| 7. | 20746 | 86.6% | 29.9%(+56.7)#7 | 12.5%(+74.2)#212 |
| 8. | 20774 | 86.5% | 29.9%(+56.6)#8 | 12.5%(+74.1)#215 |
| 9. | 20721 | 86.4% | 29.9%(+56.5)#9 | 12.5%(+73.9)#216 |
| 10. | 20748 | 84.4% | 29.9%(+54.5)#10 | 12.5%(+71.9)#248 |
| 11. | 20743 | 82.9% | 29.9%(+53.0)#11 | 12.5%(+70.4)#266 |
| 12. | 21217 | 82.1% | 29.9%(+52.2)#12 | 12.5%(+69.7)#275 |
| 13. | 21705 | 80.0% | 29.9%(+50.1)#13 | 12.5%(+67.5)#324 |
| 14. | 21207 | 79.4% | 29.9%(+49.5)#14 | 12.5%(+66.9)#341 |
| 15. | 21133 | 78.9% | 29.9%(+49.0)#15 | 12.5%(+66.5)#351 |
| 16. | 20735 | 77.5% | 29.9%(+47.6)#16 | 12.5%(+65.0)#383 |
| 17. | 20772 | 77.5% | 29.9%(+47.6)#17 | 12.5%(+65.0)#385 |
| 18. | 21239 | 76.8% | 29.9%(+46.9)#18 | 12.5%(+64.3)#391 |
| 19. | 20616 | 75.6% | 29.9%(+45.7)#19 | 12.5%(+63.2)#416 |
| 20. | 21215 | 75.2% | 29.9%(+45.3)#20 | 12.5%(+62.8)#422 |
| 21. | 21229 | 74.2% | 29.9%(+44.3)#21 | 12.5%(+61.7)#448 |
| 22. | 21223 | 74.1% | 29.9%(+44.2)#22 | 12.5%(+61.7)#452 |
| 23. | 20785 | 73.6% | 29.9%(+43.7)#23 | 12.5%(+61.1)#461 |
| 24. | 21244 | 73.1% | 29.9%(+43.2)#24 | 12.5%(+60.6)#472 |
| 25. | 21206 | 72.0% | 29.9%(+42.1)#25 | 12.5%(+59.6)#492 |
| 26. | 20720 | 69.8% | 29.9%(+39.9)#26 | 12.5%(+57.3)#558 |
| 27. | 21251 | 69.3% | 29.9%(+39.4)#27 | 12.5%(+56.8)#569 |
| 28. | 20716 | 68.7% | 29.9%(+38.8)#28 | 12.5%(+56.2)#577 |
| 29. | 20744 | 67.1% | 29.9%(+37.2)#29 | 12.5%(+54.6)#620 |
| 30. | 21890 | 67.0% | 29.9%(+37.1)#30 | 12.5%(+54.5)#626 |
| 31. | 20607 | 65.8% | 29.9%(+35.9)#31 | 12.5%(+53.3)#666 |
| 32. | 20710 | 65.6% | 29.9%(+35.7)#32 | 12.5%(+53.2)#671 |
| 33. | 21746 | 65.4% | 29.9%(+35.5)#33 | 12.5%(+52.9)#675 |
| 34. | 20613 | 64.5% | 29.9%(+34.6)#34 | 12.5%(+52.0)#706 |
| 35. | 20708 | 64.5% | 29.9%(+34.6)#35 | 12.5%(+52.0)#707 |
| 36. | 20602 | 64.2% | 29.9%(+34.3)#36 | 12.5%(+51.7)#719 |
| 37. | 21205 | 63.4% | 29.9%(+33.5)#37 | 12.5%(+50.9)#748 |
| 38. | 20745 | 63.1% | 29.9%(+33.2)#38 | 12.5%(+50.6)#754 |
| 39. | 20706 | 61.7% | 29.9%(+31.8)#39 | 12.5%(+49.2)#804 |
| 40. | 20603 | 61.1% | 29.9%(+31.2)#40 | 12.5%(+48.6)#826 |
| 41. | 21218 | 60.2% | 29.9%(+30.3)#41 | 12.5%(+47.7)#864 |
| 42. | 21214 | 58.9% | 29.9%(+29.0)#42 | 12.5%(+46.4)#907 |
| 43. | 20695 | 57.5% | 29.9%(+27.7)#43 | 12.5%(+45.1)#951 |
| 44. | 20601 | 56.3% | 29.9%(+26.4)#44 | 12.5%(+43.8)#993 |
| 45. | 20640 | 54.7% | 29.9%(+24.8)#45 | 12.5%(+42.2)#1,050 |
| 46. | 21201 | 54.6% | 29.9%(+24.7)#46 | 12.5%(+42.1)#1,053 |
| 47. | 20784 | 53.9% | 29.9%(+24.0)#47 | 12.5%(+41.4)#1,081 |
| 48. | 21202 | 53.6% | 29.9%(+23.7)#48 | 12.5%(+41.2)#1,089 |
| 49. | 21853 | 53.3% | 29.9%(+23.4)#49 | 12.5%(+40.8)#1,105 |
| 50. | 21117 | 52.6% | 29.9%(+22.7)#50 | 12.5%(+40.1)#1,122 |
| 51. | 21902 | 52.2% | 29.9%(+22.3)#51 | 12.5%(+39.7)#1,148 |
| 52. | 20770 | 51.0% | 29.9%(+21.1)#52 | 12.5%(+38.5)#1,200 |
| 53. | 20904 | 50.0% | 29.9%(+20.1)#53 | 12.5%(+37.5)#1,250 |
| 54. | 20618 | 47.7% | 29.9%(+17.8)#54 | 12.5%(+35.2)#1,369 |
| 55. | 21040 | 47.3% | 29.9%(+17.4)#55 | 12.5%(+34.9)#1,388 |
| 56. | 20707 | 47.2% | 29.9%(+17.3)#56 | 12.5%(+34.7)#1,395 |
| 57. | 20866 | 46.1% | 29.9%(+16.2)#57 | 12.5%(+33.6)#1,452 |
| 58. | 20724 | 45.4% | 29.9%(+15.6)#58 | 12.5%(+33.0)#1,486 |
| 59. | 20701 | 45.3% | 29.9%(+15.4)#59 | 12.5%(+32.9)#1,498 |
| 60. | 20769 | 45.3% | 29.9%(+15.4)#60 | 12.5%(+32.8)#1,502 |
| 61. | 20899 | 44.1% | 29.9%(+14.2)#61 | 12.5%(+31.6)#1,568 |
| 62. | 21225 | 43.6% | 29.9%(+13.7)#62 | 12.5%(+31.1)#1,596 |
| 63. | 20794 | 43.3% | 29.9%(+13.4)#63 | 12.5%(+30.8)#1,614 |
| 64. | 20712 | 42.8% | 29.9%(+13.0)#64 | 12.5%(+30.4)#1,643 |
| 65. | 21208 | 42.0% | 29.9%(+12.1)#65 | 12.5%(+29.5)#1,698 |
| 66. | 21005 | 41.1% | 29.9%(+11.2)#66 | 12.5%(+28.6)#1,766 |
| 67. | 20763 | 38.8% | 29.9%(+8.86)#67 | 12.5%(+26.3)#1,944 |
| 68. | 21237 | 38.4% | 29.9%(+8.53)#68 | 12.5%(+26.0)#1,975 |
| 69. | 20715 | 38.1% | 29.9%(+8.19)#69 | 12.5%(+25.6)#1,993 |
| 70. | 20782 | 37.8% | 29.9%(+7.91)#70 | 12.5%(+25.3)#2,014 |
| 71. | 21212 | 37.4% | 29.9%(+7.51)#71 | 12.5%(+24.9)#2,036 |
| 72. | 21851 | 36.8% | 29.9%(+6.96)#72 | 12.5%(+24.4)#2,075 |
| 73. | 20608 | 36.8% | 29.9%(+6.92)#73 | 12.5%(+24.3)#2,077 |
| 74. | 20705 | 36.5% | 29.9%(+6.58)#74 | 12.5%(+24.0)#2,097 |
| 75. | 20675 | 34.7% | 29.9%(+4.77)#75 | 12.5%(+22.2)#2,247 |
| 76. | 20912 | 34.6% | 29.9%(+4.72)#76 | 12.5%(+22.1)#2,256 |
| 77. | 21822 | 34.6% | 29.9%(+4.69)#77 | 12.5%(+22.1)#2,259 |
| 78. | 21250 | 34.0% | 29.9%(+4.10)#78 | 12.5%(+21.5)#2,307 |
| 79. | 21801 | 33.7% | 29.9%(+3.85)#79 | 12.5%(+21.3)#2,322 |
| 80. | 21613 | 33.6% | 29.9%(+3.72)#80 | 12.5%(+21.1)#2,332 |
| 81. | 20606 | 33.6% | 29.9%(+3.71)#81 | 12.5%(+21.1)#2,334 |
| 82. | 21076 | 33.3% | 29.9%(+3.38)#82 | 12.5%(+20.8)#2,363 |
| 83. | 20722 | 33.1% | 29.9%(+3.24)#83 | 12.5%(+20.7)#2,376 |
| 84. | 20634 | 33.0% | 29.9%(+3.06)#84 | 12.5%(+20.5)#2,391 |
| 85. | 21144 | 32.9% | 29.9%(+3.05)#85 | 12.5%(+20.5)#2,392 |
| 86. | 21252 | 32.3% | 29.9%(+2.45)#86 | 12.5%(+19.9)#2,442 |
| 87. | 21046 | 31.7% | 29.9%(+1.76)#87 | 12.5%(+19.2)#2,498 |
| 88. | 20723 | 31.3% | 29.9%(+1.40)#88 | 12.5%(+18.8)#2,531 |
| 89. | 21045 | 31.2% | 29.9%(+1.29)#89 | 12.5%(+18.7)#2,541 |
| 90. | 20910 | 30.7% | 29.9%(+0.833)#90 | 12.5%(+18.3)#2,578 |
| 91. | 21077 | 30.5% | 29.9%(+0.583)#91 | 12.5%(+18.0)#2,600 |
| 92. | 20876 | 30.5% | 29.9%(+0.575)#92 | 12.5%(+18.0)#2,601 |
| 93. | 21221 | 30.4% | 29.9%(+0.496)#93 | 12.5%(+17.9)#2,608 |
| 94. | 20765 | 30.0% | 29.9%(+0.074)#94 | 12.5%(+17.5)#2,644 |
| 95. | 21804 | 29.7% | 29.9%(-0.163)#95 | 12.5%(+17.3)#2,671 |
| 96. | 21234 | 29.7% | 29.9%(-0.169)#96 | 12.5%(+17.3)#2,673 |
| 97. | 21869 | 29.7% | 29.9%(-0.201)#97 | 12.5%(+17.2)#2,677 |
| 98. | 20901 | 29.2% | 29.9%(-0.673)#98 | 12.5%(+16.8)#2,728 |
| 99. | 20662 | 28.8% | 29.9%(-1.13)#99 | 12.5%(+16.3)#2,774 |
| 100. | 20637 | 28.2% | 29.9%(-1.71)#100 | 12.5%(+15.7)#2,837 |
Common Questions
What are the Top 10 Zip Codes with the Highest Percentage of Black / African American Population in Maryland?
Top 10 Zip Codes with the Highest Percentage of Black / African American Population in Maryland are:
What zip code has the Highest Percentage of Black / African American Population in Maryland?
20656 has the Highest Percentage of Black / African American Population in Maryland with 100.0%.
What is the Percentage of Black / African American Population in the State of Maryland?
Percentage of Black / African American Population in Maryland is 29.9%.
What is the Percentage of Black / African American Population in the United States?
Percentage of Black / African American Population in the United States is 12.5%.