Zip Codes with the Highest Percentage of Population with a Degree in Literature and Languages in Maryland
RELATED REPORTS & OPTIONS
Literature and Languages
Maryland
Compare Zip Codes
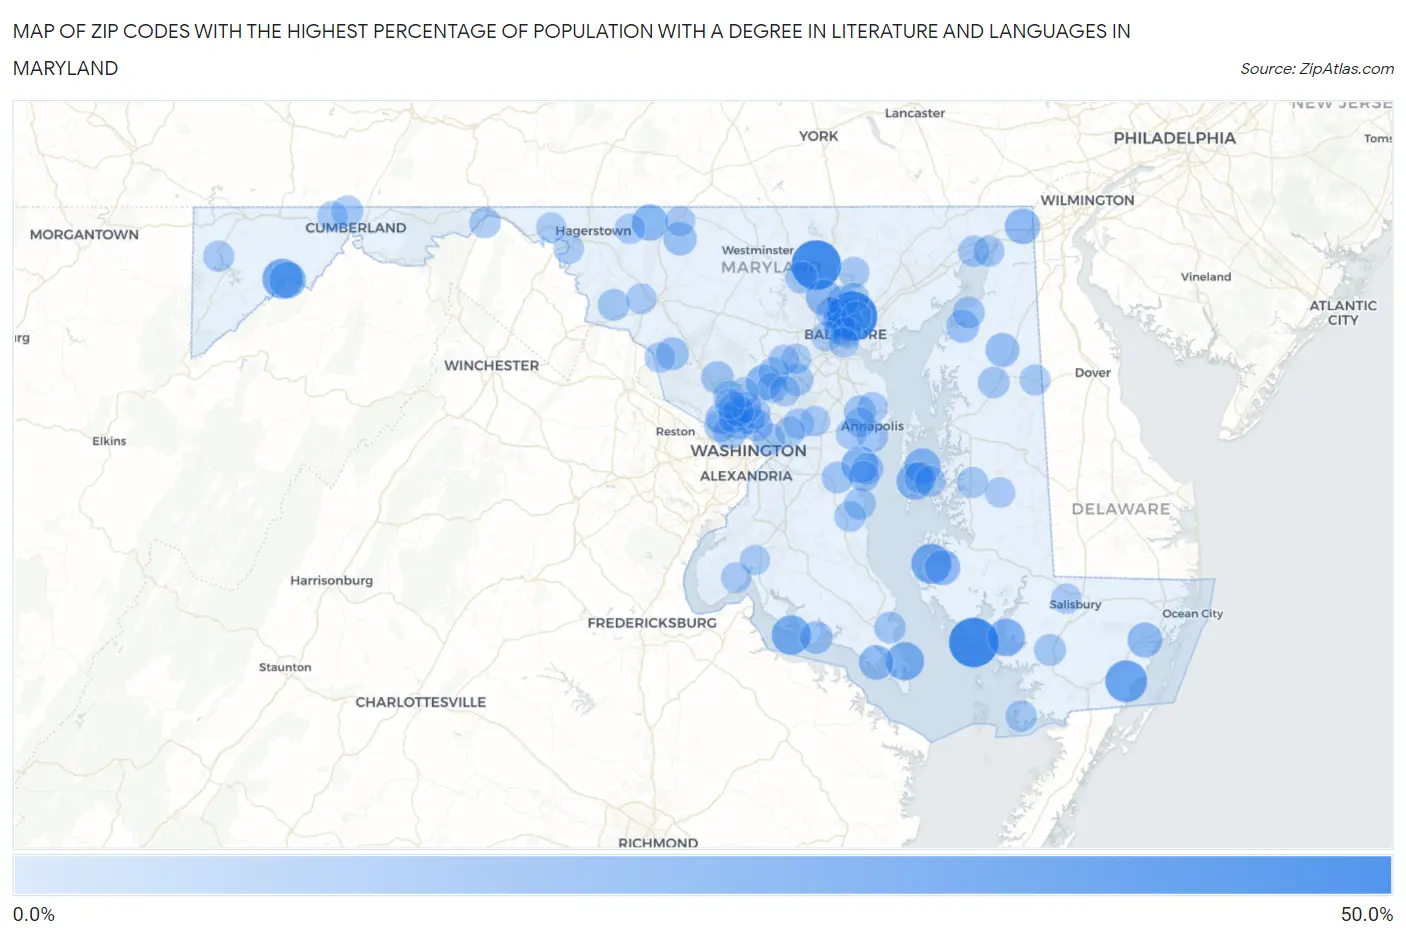
Map of Zip Codes with the Highest Percentage of Population with a Degree in Literature and Languages in Maryland
0.0%
50.0%
Zip Codes with the Highest Percentage of Population with a Degree in Literature and Languages in Maryland
| Zip Code | % Graduates | vs State | vs National | |
| 1. | 21251 | 50.0% | 4.8%(+45.2)#1 | 4.4%(+45.6)#64 |
| 2. | 21023 | 50.0% | 4.8%(+45.2)#2 | 4.4%(+45.6)#74 |
| 3. | 21627 | 50.0% | 4.8%(+45.2)#3 | 4.4%(+45.6)#79 |
| 4. | 21829 | 31.9% | 4.8%(+27.2)#4 | 4.4%(+27.5)#185 |
| 5. | 21523 | 28.1% | 4.8%(+23.4)#5 | 4.4%(+23.7)#227 |
| 6. | 21648 | 28.0% | 4.8%(+23.2)#6 | 4.4%(+23.6)#231 |
| 7. | 20625 | 26.2% | 4.8%(+21.5)#7 | 4.4%(+21.8)#275 |
| 8. | 20628 | 23.9% | 4.8%(+19.1)#8 | 4.4%(+19.5)#338 |
| 9. | 21840 | 22.2% | 4.8%(+17.5)#9 | 4.4%(+17.8)#386 |
| 10. | 21676 | 21.0% | 4.8%(+16.2)#10 | 4.4%(+16.6)#438 |
| 11. | 20765 | 20.4% | 4.8%(+15.7)#11 | 4.4%(+16.0)#457 |
| 12. | 21540 | 20.0% | 4.8%(+15.2)#12 | 4.4%(+15.6)#481 |
| 13. | 21780 | 18.9% | 4.8%(+14.2)#13 | 4.4%(+14.5)#525 |
| 14. | 21624 | 18.9% | 4.8%(+14.1)#14 | 4.4%(+14.5)#528 |
| 15. | 21153 | 18.4% | 4.8%(+13.6)#15 | 4.4%(+14.0)#555 |
| 16. | 20868 | 18.1% | 4.8%(+13.3)#16 | 4.4%(+13.6)#574 |
| 17. | 21677 | 17.3% | 4.8%(+12.6)#17 | 4.4%(+12.9)#612 |
| 18. | 21920 | 17.2% | 4.8%(+12.5)#18 | 4.4%(+12.8)#617 |
| 19. | 21841 | 16.0% | 4.8%(+11.3)#19 | 4.4%(+11.6)#720 |
| 20. | 20630 | 15.6% | 4.8%(+10.8)#20 | 4.4%(+11.1)#769 |
| 21. | 21628 | 14.1% | 4.8%(+9.32)#21 | 4.4%(+9.67)#920 |
| 22. | 21778 | 12.7% | 4.8%(+7.95)#22 | 4.4%(+8.30)#1,097 |
| 23. | 20896 | 12.4% | 4.8%(+7.65)#23 | 4.4%(+8.01)#1,154 |
| 24. | 21678 | 12.0% | 4.8%(+7.26)#24 | 4.4%(+7.62)#1,221 |
| 25. | 20816 | 11.7% | 4.8%(+6.92)#25 | 4.4%(+7.28)#1,289 |
| 26. | 20606 | 11.6% | 4.8%(+6.86)#26 | 4.4%(+7.22)#1,304 |
| 27. | 20838 | 11.4% | 4.8%(+6.66)#27 | 4.4%(+7.02)#1,353 |
| 28. | 20880 | 11.0% | 4.8%(+6.28)#28 | 4.4%(+6.64)#1,460 |
| 29. | 20912 | 10.1% | 4.8%(+5.29)#29 | 4.4%(+5.65)#1,794 |
| 30. | 20722 | 9.9% | 4.8%(+5.14)#30 | 4.4%(+5.50)#1,870 |
| 31. | 21071 | 9.8% | 4.8%(+5.05)#31 | 4.4%(+5.40)#1,909 |
| 32. | 20763 | 9.6% | 4.8%(+4.82)#32 | 4.4%(+5.17)#2,007 |
| 33. | 21853 | 9.5% | 4.8%(+4.74)#33 | 4.4%(+5.10)#2,040 |
| 34. | 21610 | 9.4% | 4.8%(+4.67)#34 | 4.4%(+5.02)#2,071 |
| 35. | 21212 | 9.4% | 4.8%(+4.61)#35 | 4.4%(+4.97)#2,101 |
| 36. | 21210 | 9.3% | 4.8%(+4.55)#36 | 4.4%(+4.90)#2,140 |
| 37. | 20815 | 9.3% | 4.8%(+4.49)#37 | 4.4%(+4.85)#2,175 |
| 38. | 20711 | 9.2% | 4.8%(+4.48)#38 | 4.4%(+4.83)#2,183 |
| 39. | 20764 | 9.1% | 4.8%(+4.36)#39 | 4.4%(+4.72)#2,245 |
| 40. | 20818 | 9.1% | 4.8%(+4.35)#40 | 4.4%(+4.70)#2,255 |
| 41. | 20910 | 9.1% | 4.8%(+4.34)#41 | 4.4%(+4.69)#2,260 |
| 42. | 21718 | 9.1% | 4.8%(+4.33)#42 | 4.4%(+4.68)#2,282 |
| 43. | 20670 | 8.9% | 4.8%(+4.15)#43 | 4.4%(+4.51)#2,363 |
| 44. | 21623 | 8.9% | 4.8%(+4.15)#44 | 4.4%(+4.51)#2,365 |
| 45. | 21405 | 8.8% | 4.8%(+4.08)#45 | 4.4%(+4.44)#2,398 |
| 46. | 21211 | 8.8% | 4.8%(+4.04)#46 | 4.4%(+4.40)#2,418 |
| 47. | 20714 | 8.8% | 4.8%(+4.02)#47 | 4.4%(+4.37)#2,428 |
| 48. | 21647 | 8.6% | 4.8%(+3.84)#48 | 4.4%(+4.20)#2,540 |
| 49. | 20817 | 8.5% | 4.8%(+3.77)#49 | 4.4%(+4.12)#2,590 |
| 50. | 21403 | 8.5% | 4.8%(+3.77)#50 | 4.4%(+4.12)#2,591 |
| 51. | 21524 | 8.4% | 4.8%(+3.67)#51 | 4.4%(+4.02)#2,660 |
| 52. | 21817 | 8.3% | 4.8%(+3.53)#52 | 4.4%(+3.88)#2,753 |
| 53. | 21218 | 8.2% | 4.8%(+3.46)#53 | 4.4%(+3.81)#2,801 |
| 54. | 21750 | 8.2% | 4.8%(+3.45)#54 | 4.4%(+3.80)#2,807 |
| 55. | 21204 | 8.1% | 4.8%(+3.35)#55 | 4.4%(+3.71)#2,889 |
| 56. | 21903 | 8.0% | 4.8%(+3.22)#56 | 4.4%(+3.58)#2,994 |
| 57. | 20689 | 8.0% | 4.8%(+3.20)#57 | 4.4%(+3.55)#3,014 |
| 58. | 21217 | 7.9% | 4.8%(+3.10)#58 | 4.4%(+3.45)#3,098 |
| 59. | 21663 | 7.9% | 4.8%(+3.09)#59 | 4.4%(+3.44)#3,106 |
| 60. | 21914 | 7.8% | 4.8%(+3.04)#60 | 4.4%(+3.40)#3,155 |
| 61. | 21601 | 7.7% | 4.8%(+2.98)#61 | 4.4%(+3.33)#3,210 |
| 62. | 20814 | 7.7% | 4.8%(+2.93)#62 | 4.4%(+3.28)#3,273 |
| 63. | 21131 | 7.6% | 4.8%(+2.83)#63 | 4.4%(+3.19)#3,353 |
| 64. | 20733 | 7.6% | 4.8%(+2.80)#64 | 4.4%(+3.15)#3,382 |
| 65. | 21541 | 7.5% | 4.8%(+2.73)#65 | 4.4%(+3.08)#3,448 |
| 66. | 20851 | 7.4% | 4.8%(+2.68)#66 | 4.4%(+3.04)#3,503 |
| 67. | 20901 | 7.4% | 4.8%(+2.66)#67 | 4.4%(+3.01)#3,526 |
| 68. | 21140 | 7.3% | 4.8%(+2.53)#68 | 4.4%(+2.89)#3,662 |
| 69. | 20902 | 7.3% | 4.8%(+2.53)#69 | 4.4%(+2.89)#3,664 |
| 70. | 21649 | 7.3% | 4.8%(+2.51)#70 | 4.4%(+2.87)#3,675 |
| 71. | 21012 | 7.1% | 4.8%(+2.33)#71 | 4.4%(+2.69)#3,866 |
| 72. | 20759 | 7.1% | 4.8%(+2.33)#72 | 4.4%(+2.69)#3,871 |
| 73. | 20895 | 6.9% | 4.8%(+2.12)#73 | 4.4%(+2.48)#4,120 |
| 74. | 21209 | 6.9% | 4.8%(+2.10)#74 | 4.4%(+2.45)#4,157 |
| 75. | 20842 | 6.8% | 4.8%(+2.08)#75 | 4.4%(+2.43)#4,189 |
| 76. | 20769 | 6.8% | 4.8%(+2.04)#76 | 4.4%(+2.40)#4,230 |
| 77. | 20866 | 6.7% | 4.8%(+1.91)#77 | 4.4%(+2.27)#4,388 |
| 78. | 21714 | 6.6% | 4.8%(+1.86)#78 | 4.4%(+2.22)#4,461 |
| 79. | 20693 | 6.5% | 4.8%(+1.77)#79 | 4.4%(+2.12)#4,599 |
| 80. | 21202 | 6.5% | 4.8%(+1.73)#80 | 4.4%(+2.08)#4,645 |
| 81. | 21044 | 6.5% | 4.8%(+1.70)#81 | 4.4%(+2.05)#4,703 |
| 82. | 21655 | 6.4% | 4.8%(+1.62)#82 | 4.4%(+1.97)#4,821 |
| 83. | 21727 | 6.3% | 4.8%(+1.58)#83 | 4.4%(+1.93)#4,866 |
| 84. | 21401 | 6.3% | 4.8%(+1.53)#84 | 4.4%(+1.89)#4,940 |
| 85. | 21545 | 6.3% | 4.8%(+1.51)#85 | 4.4%(+1.87)#4,963 |
| 86. | 20715 | 6.3% | 4.8%(+1.50)#86 | 4.4%(+1.86)#4,977 |
| 87. | 20906 | 6.3% | 4.8%(+1.50)#87 | 4.4%(+1.85)#4,989 |
| 88. | 21286 | 6.3% | 4.8%(+1.49)#88 | 4.4%(+1.85)#4,991 |
| 89. | 21795 | 6.2% | 4.8%(+1.45)#89 | 4.4%(+1.81)#5,070 |
| 90. | 21783 | 6.2% | 4.8%(+1.42)#90 | 4.4%(+1.78)#5,110 |
| 91. | 20852 | 6.1% | 4.8%(+1.38)#91 | 4.4%(+1.74)#5,181 |
| 92. | 21801 | 6.1% | 4.8%(+1.31)#92 | 4.4%(+1.67)#5,302 |
| 93. | 21045 | 6.0% | 4.8%(+1.27)#93 | 4.4%(+1.63)#5,361 |
| 94. | 20707 | 6.0% | 4.8%(+1.27)#94 | 4.4%(+1.63)#5,362 |
| 95. | 21229 | 6.0% | 4.8%(+1.24)#95 | 4.4%(+1.60)#5,406 |
| 96. | 20706 | 5.9% | 4.8%(+1.14)#96 | 4.4%(+1.50)#5,586 |
| 97. | 21214 | 5.8% | 4.8%(+1.07)#97 | 4.4%(+1.43)#5,695 |
| 98. | 21230 | 5.8% | 4.8%(+0.987)#98 | 4.4%(+1.34)#5,839 |
| 99. | 21722 | 5.7% | 4.8%(+0.976)#99 | 4.4%(+1.33)#5,857 |
| 100. | 20646 | 5.7% | 4.8%(+0.962)#100 | 4.4%(+1.32)#5,888 |
Common Questions
What are the Top 10 Zip Codes with the Highest Percentage of Population with a Degree in Literature and Languages in Maryland?
Top 10 Zip Codes with the Highest Percentage of Population with a Degree in Literature and Languages in Maryland are:
What zip code has the Highest Percentage of Population with a Degree in Literature and Languages in Maryland?
21251 has the Highest Percentage of Population with a Degree in Literature and Languages in Maryland with 50.0%.
What is the Percentage of Population with a Degree in Literature and Languages in the State of Maryland?
Percentage of Population with a Degree in Literature and Languages in Maryland is 4.8%.
What is the Percentage of Population with a Degree in Literature and Languages in the United States?
Percentage of Population with a Degree in Literature and Languages in the United States is 4.4%.