Zip Codes with the Highest Percentage of Families with Income Below $10,000 in Maryland
RELATED REPORTS & OPTIONS
Family Income | $0-10k
Maryland
Compare Zip Codes
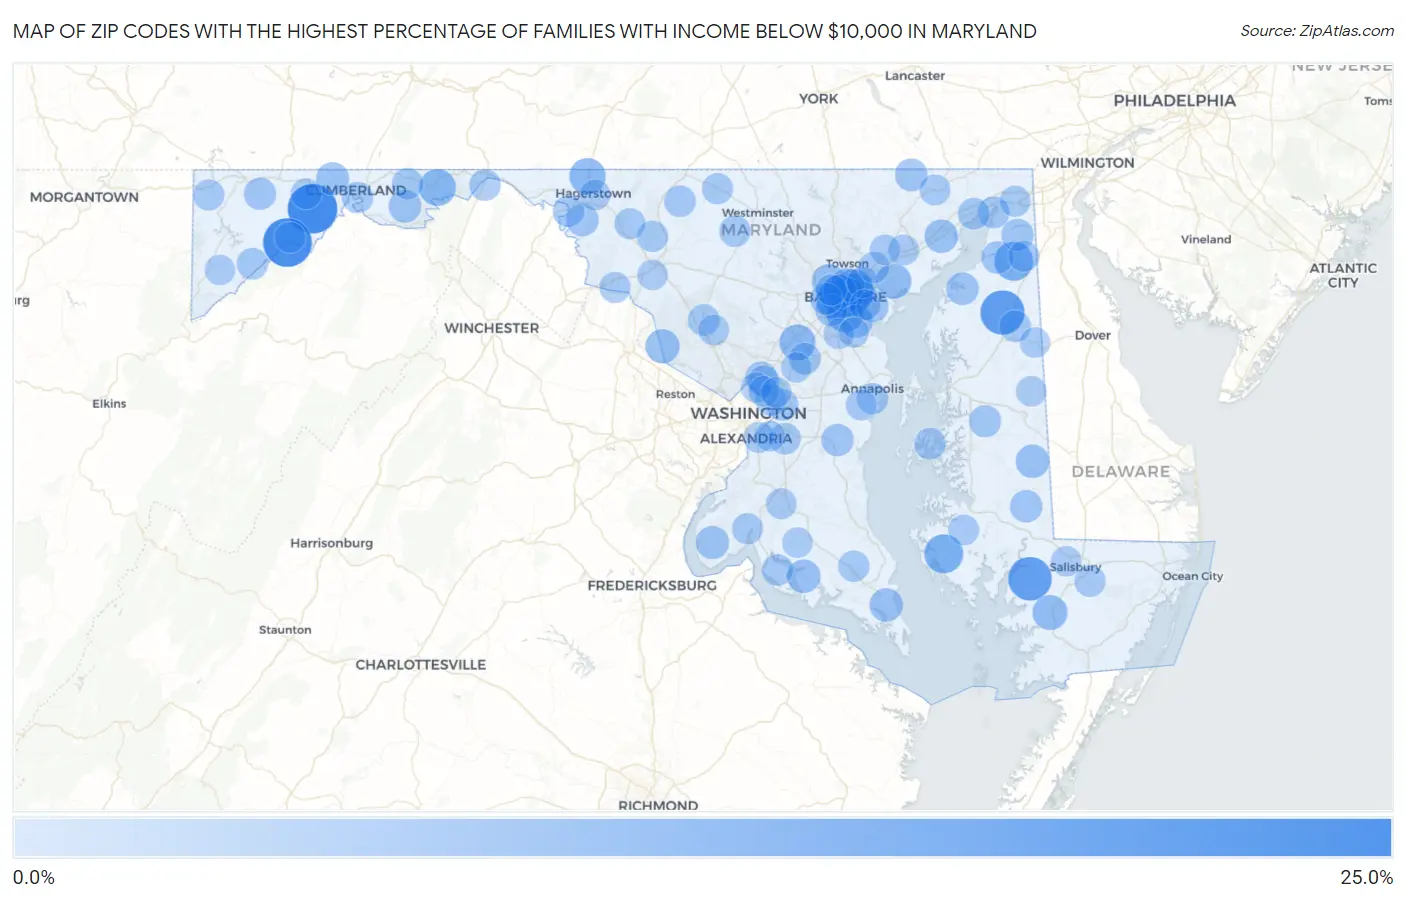
Map of Zip Codes with the Highest Percentage of Families with Income Below $10,000 in Maryland
0.0%
25.0%
Zip Codes with the Highest Percentage of Families with Income Below $10,000 in Maryland
| Zip Code | Families with Income < $10k | vs State | vs National | |
| 1. | 21542 | 25.0% | 2.4%(+22.6)#1 | 3.1%(+21.9)#306 |
| 2. | 21540 | 24.0% | 2.4%(+21.6)#2 | 3.1%(+20.9)#334 |
| 3. | 21628 | 18.8% | 2.4%(+16.4)#3 | 3.1%(+15.7)#539 |
| 4. | 21856 | 18.0% | 2.4%(+15.6)#4 | 3.1%(+14.9)#587 |
| 5. | 21201 | 17.0% | 2.4%(+14.6)#5 | 3.1%(+13.9)#668 |
| 6. | 21223 | 13.1% | 2.4%(+10.7)#6 | 3.1%(+10.00)#1,102 |
| 7. | 21622 | 12.6% | 2.4%(+10.2)#7 | 3.1%(+9.50)#1,208 |
| 8. | 21213 | 12.5% | 2.4%(+10.1)#8 | 3.1%(+9.40)#1,212 |
| 9. | 21913 | 12.5% | 2.4%(+10.1)#9 | 3.1%(+9.40)#1,224 |
| 10. | 21231 | 12.0% | 2.4%(+9.60)#10 | 3.1%(+8.90)#1,319 |
| 11. | 21205 | 11.8% | 2.4%(+9.40)#11 | 3.1%(+8.70)#1,371 |
| 12. | 21225 | 10.4% | 2.4%(+8.00)#12 | 3.1%(+7.30)#1,775 |
| 13. | 21766 | 10.1% | 2.4%(+7.70)#13 | 3.1%(+7.00)#1,895 |
| 14. | 21767 | 9.5% | 2.4%(+7.10)#14 | 3.1%(+6.40)#2,136 |
| 15. | 20763 | 9.3% | 2.4%(+6.90)#15 | 3.1%(+6.20)#2,212 |
| 16. | 21202 | 8.9% | 2.4%(+6.50)#16 | 3.1%(+5.80)#2,403 |
| 17. | 21220 | 8.4% | 2.4%(+6.00)#17 | 3.1%(+5.30)#2,701 |
| 18. | 21853 | 8.1% | 2.4%(+5.70)#18 | 3.1%(+5.00)#2,915 |
| 19. | 20837 | 7.1% | 2.4%(+4.70)#19 | 3.1%(+4.00)#3,568 |
| 20. | 21215 | 6.9% | 2.4%(+4.50)#20 | 3.1%(+3.80)#3,690 |
| 21. | 21218 | 6.9% | 2.4%(+4.50)#21 | 3.1%(+3.80)#3,691 |
| 22. | 21632 | 6.5% | 2.4%(+4.10)#22 | 3.1%(+3.40)#4,133 |
| 23. | 20653 | 6.4% | 2.4%(+4.00)#23 | 3.1%(+3.30)#4,207 |
| 24. | 20621 | 6.4% | 2.4%(+4.00)#24 | 3.1%(+3.30)#4,274 |
| 25. | 21217 | 6.3% | 2.4%(+3.90)#25 | 3.1%(+3.20)#4,300 |
| 26. | 21001 | 6.3% | 2.4%(+3.90)#26 | 3.1%(+3.20)#4,305 |
| 27. | 21226 | 6.1% | 2.4%(+3.70)#27 | 3.1%(+3.00)#4,577 |
| 28. | 20662 | 6.1% | 2.4%(+3.70)#28 | 3.1%(+3.00)#4,589 |
| 29. | 21545 | 5.9% | 2.4%(+3.50)#29 | 3.1%(+2.80)#4,855 |
| 30. | 21555 | 5.7% | 2.4%(+3.30)#30 | 3.1%(+2.60)#5,093 |
| 31. | 21160 | 5.6% | 2.4%(+3.20)#31 | 3.1%(+2.50)#5,232 |
| 32. | 21678 | 5.4% | 2.4%(+3.00)#32 | 3.1%(+2.30)#5,548 |
| 33. | 20711 | 5.3% | 2.4%(+2.90)#33 | 3.1%(+2.20)#5,654 |
| 34. | 21659 | 5.3% | 2.4%(+2.90)#34 | 3.1%(+2.20)#5,701 |
| 35. | 21919 | 5.2% | 2.4%(+2.80)#35 | 3.1%(+2.10)#5,843 |
| 36. | 21733 | 5.2% | 2.4%(+2.80)#36 | 3.1%(+2.10)#5,882 |
| 37. | 21915 | 5.1% | 2.4%(+2.70)#37 | 3.1%(+2.00)#6,016 |
| 38. | 21536 | 4.9% | 2.4%(+2.50)#38 | 3.1%(+1.80)#6,348 |
| 39. | 21222 | 4.8% | 2.4%(+2.40)#39 | 3.1%(+1.70)#6,411 |
| 40. | 21227 | 4.8% | 2.4%(+2.40)#40 | 3.1%(+1.70)#6,427 |
| 41. | 21625 | 4.8% | 2.4%(+2.40)#41 | 3.1%(+1.70)#6,537 |
| 42. | 21229 | 4.7% | 2.4%(+2.30)#42 | 3.1%(+1.60)#6,613 |
| 43. | 20903 | 4.7% | 2.4%(+2.30)#43 | 3.1%(+1.60)#6,641 |
| 44. | 21901 | 4.5% | 2.4%(+2.10)#44 | 3.1%(+1.40)#7,026 |
| 45. | 20724 | 4.5% | 2.4%(+2.10)#45 | 3.1%(+1.40)#7,031 |
| 46. | 20783 | 4.4% | 2.4%(+2.00)#46 | 3.1%(+1.30)#7,201 |
| 47. | 21903 | 4.4% | 2.4%(+2.00)#47 | 3.1%(+1.30)#7,298 |
| 48. | 20762 | 4.4% | 2.4%(+2.00)#48 | 3.1%(+1.30)#7,320 |
| 49. | 20876 | 4.3% | 2.4%(+1.90)#49 | 3.1%(+1.20)#7,435 |
| 50. | 21668 | 4.3% | 2.4%(+1.90)#50 | 3.1%(+1.20)#7,551 |
| 51. | 21778 | 4.3% | 2.4%(+1.90)#51 | 3.1%(+1.20)#7,578 |
| 52. | 21538 | 4.3% | 2.4%(+1.90)#52 | 3.1%(+1.20)#7,594 |
| 53. | 20785 | 4.2% | 2.4%(+1.80)#53 | 3.1%(+1.10)#7,641 |
| 54. | 21663 | 4.2% | 2.4%(+1.80)#54 | 3.1%(+1.10)#7,773 |
| 55. | 21530 | 4.2% | 2.4%(+1.80)#55 | 3.1%(+1.10)#7,803 |
| 56. | 21206 | 4.1% | 2.4%(+1.70)#56 | 3.1%(+1.000)#7,868 |
| 57. | 20781 | 4.1% | 2.4%(+1.70)#57 | 3.1%(+1.000)#7,949 |
| 58. | 21795 | 4.1% | 2.4%(+1.70)#58 | 3.1%(+1.000)#7,977 |
| 59. | 21750 | 4.1% | 2.4%(+1.70)#59 | 3.1%(+1.000)#8,014 |
| 60. | 20636 | 4.0% | 2.4%(+1.60)#60 | 3.1%(+0.900)#8,218 |
| 61. | 21776 | 4.0% | 2.4%(+1.60)#61 | 3.1%(+0.900)#8,247 |
| 62. | 20664 | 4.0% | 2.4%(+1.60)#62 | 3.1%(+0.900)#8,281 |
| 63. | 21502 | 3.9% | 2.4%(+1.50)#63 | 3.1%(+0.800)#8,388 |
| 64. | 21236 | 3.9% | 2.4%(+1.50)#64 | 3.1%(+0.800)#8,393 |
| 65. | 21403 | 3.9% | 2.4%(+1.50)#65 | 3.1%(+0.800)#8,406 |
| 66. | 21216 | 3.9% | 2.4%(+1.50)#66 | 3.1%(+0.800)#8,420 |
| 67. | 21804 | 3.8% | 2.4%(+1.40)#67 | 3.1%(+0.700)#8,650 |
| 68. | 21702 | 3.7% | 2.4%(+1.30)#68 | 3.1%(+0.600)#8,933 |
| 69. | 21787 | 3.7% | 2.4%(+1.30)#69 | 3.1%(+0.600)#9,040 |
| 70. | 21716 | 3.7% | 2.4%(+1.30)#70 | 3.1%(+0.600)#9,064 |
| 71. | 20677 | 3.7% | 2.4%(+1.30)#71 | 3.1%(+0.600)#9,131 |
| 72. | 21531 | 3.7% | 2.4%(+1.30)#72 | 3.1%(+0.600)#9,134 |
| 73. | 21912 | 3.7% | 2.4%(+1.30)#73 | 3.1%(+0.600)#9,147 |
| 74. | 21921 | 3.6% | 2.4%(+1.20)#74 | 3.1%(+0.500)#9,222 |
| 75. | 21224 | 3.6% | 2.4%(+1.20)#75 | 3.1%(+0.500)#9,223 |
| 76. | 21773 | 3.6% | 2.4%(+1.20)#76 | 3.1%(+0.500)#9,343 |
| 77. | 21562 | 3.6% | 2.4%(+1.20)#77 | 3.1%(+0.500)#9,375 |
| 78. | 21740 | 3.5% | 2.4%(+1.10)#78 | 3.1%(+0.400)#9,469 |
| 79. | 21037 | 3.5% | 2.4%(+1.10)#79 | 3.1%(+0.400)#9,540 |
| 80. | 21532 | 3.5% | 2.4%(+1.10)#80 | 3.1%(+0.400)#9,576 |
| 81. | 20886 | 3.4% | 2.4%(+1.00)#81 | 3.1%(+0.300)#9,795 |
| 82. | 20602 | 3.4% | 2.4%(+1.00)#82 | 3.1%(+0.300)#9,814 |
| 83. | 21034 | 3.4% | 2.4%(+1.00)#83 | 3.1%(+0.300)#9,984 |
| 84. | 20745 | 3.3% | 2.4%(+0.900)#84 | 3.1%(+0.200)#10,145 |
| 85. | 21613 | 3.3% | 2.4%(+0.900)#85 | 3.1%(+0.200)#10,181 |
| 86. | 20912 | 3.2% | 2.4%(+0.800)#86 | 3.1%(+0.100)#10,474 |
| 87. | 21085 | 3.2% | 2.4%(+0.800)#87 | 3.1%(+0.100)#10,519 |
| 88. | 21087 | 3.2% | 2.4%(+0.800)#88 | 3.1%(+0.100)#10,590 |
| 89. | 21061 | 3.1% | 2.4%(+0.700)#89 | 3.1%(=0.000)#10,748 |
| 90. | 20782 | 3.1% | 2.4%(+0.700)#90 | 3.1%(=0.000)#10,784 |
| 91. | 21801 | 3.1% | 2.4%(+0.700)#91 | 3.1%(=0.000)#10,798 |
| 92. | 20737 | 3.1% | 2.4%(+0.700)#92 | 3.1%(=0.000)#10,820 |
| 93. | 20622 | 3.1% | 2.4%(+0.700)#93 | 3.1%(=0.000)#10,935 |
| 94. | 21639 | 3.1% | 2.4%(+0.700)#94 | 3.1%(=0.000)#10,940 |
| 95. | 21649 | 3.0% | 2.4%(+0.600)#95 | 3.1%(-0.100)#11,318 |
| 96. | 20748 | 2.9% | 2.4%(+0.500)#96 | 3.1%(-0.200)#11,452 |
| 97. | 21703 | 2.9% | 2.4%(+0.500)#97 | 3.1%(-0.200)#11,455 |
| 98. | 21060 | 2.9% | 2.4%(+0.500)#98 | 3.1%(-0.200)#11,459 |
| 99. | 20708 | 2.9% | 2.4%(+0.500)#99 | 3.1%(-0.200)#11,497 |
| 100. | 21550 | 2.9% | 2.4%(+0.500)#100 | 3.1%(-0.200)#11,557 |
Common Questions
What are the Top 10 Zip Codes with the Highest Percentage of Families with Income Below $10,000 in Maryland?
Top 10 Zip Codes with the Highest Percentage of Families with Income Below $10,000 in Maryland are:
What zip code has the Highest Percentage of Families with Income Below $10,000 in Maryland?
21542 has the Highest Percentage of Families with Income Below $10,000 in Maryland with 25.0%.
What is the Percentage of Families with Income Below $10,000 in the State of Maryland?
Percentage of Families with Income Below $10,000 in Maryland is 2.4%.
What is the Percentage of Families with Income Below $10,000 in the United States?
Percentage of Families with Income Below $10,000 in the United States is 3.1%.