Zip Codes with the Highest Percentage of Households Heated by Fuel Oil / Kerosene in Maryland
RELATED REPORTS & OPTIONS
Fuel Oil Heating
Maryland
Compare Zip Codes
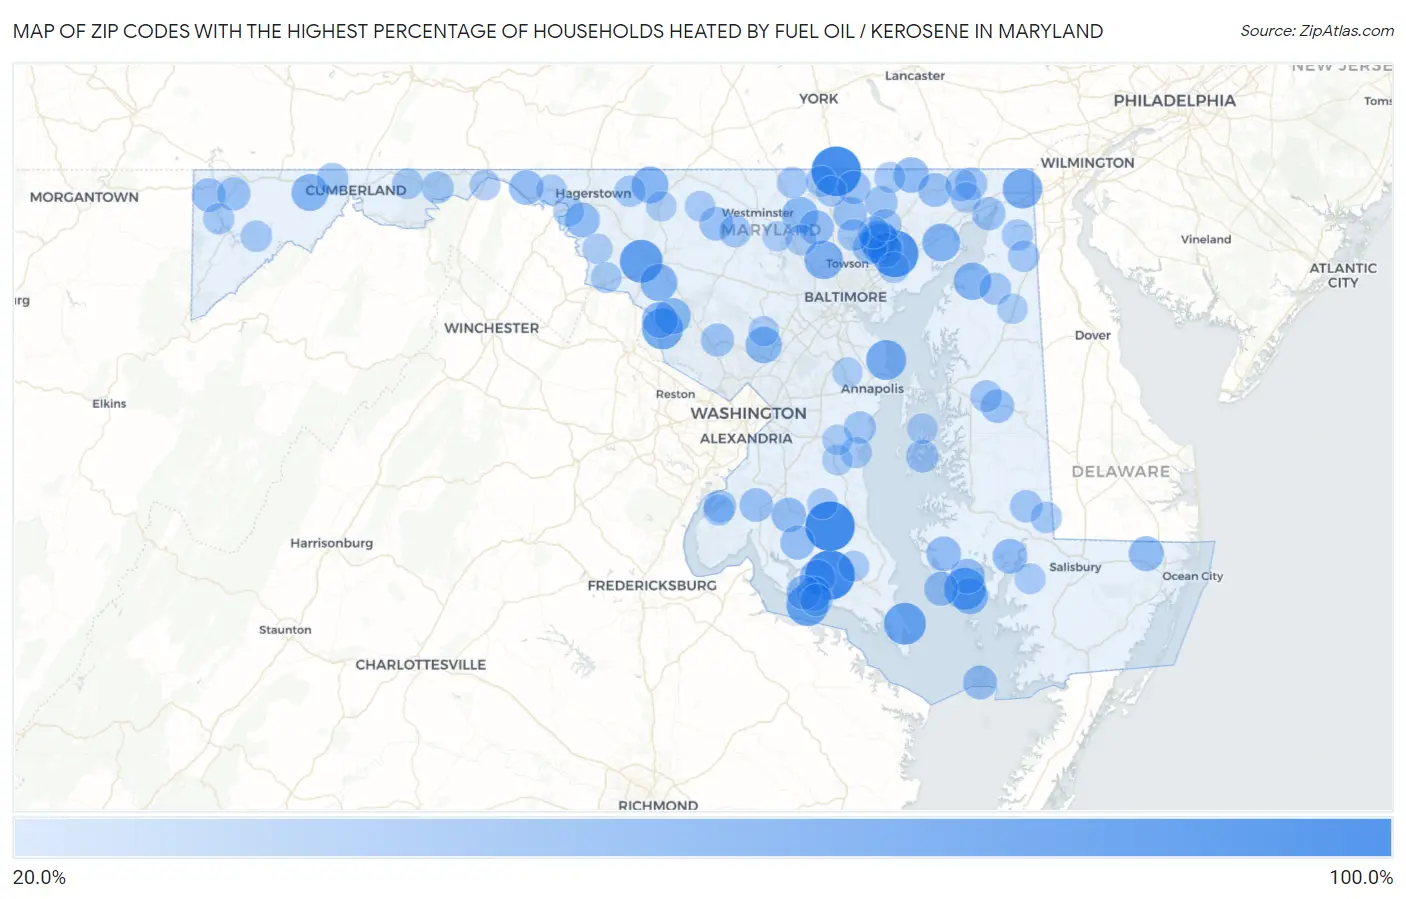
Map of Zip Codes with the Highest Percentage of Households Heated by Fuel Oil / Kerosene in Maryland
20.0%
100.0%
Zip Codes with the Highest Percentage of Households Heated by Fuel Oil / Kerosene in Maryland
| Zip Code | Fuel Oil Heating | vs State | vs National | |
| 1. | 20656 | 100.0% | 7.4%(+92.6)#1 | 4.2%(+95.8)#20 |
| 2. | 20612 | 100.0% | 7.4%(+92.6)#2 | 4.2%(+95.8)#25 |
| 3. | 21105 | 100.0% | 7.4%(+92.6)#3 | 4.2%(+95.8)#57 |
| 4. | 21156 | 89.1% | 7.4%(+81.7)#4 | 4.2%(+84.9)#169 |
| 5. | 21714 | 73.3% | 7.4%(+65.9)#5 | 4.2%(+69.1)#412 |
| 6. | 20626 | 69.7% | 7.4%(+62.3)#6 | 4.2%(+65.5)#543 |
| 7. | 20628 | 69.4% | 7.4%(+62.0)#7 | 4.2%(+65.2)#555 |
| 8. | 21675 | 68.8% | 7.4%(+61.4)#8 | 4.2%(+64.6)#579 |
| 9. | 20839 | 65.4% | 7.4%(+58.0)#9 | 4.2%(+61.2)#773 |
| 10. | 21051 | 63.4% | 7.4%(+56.0)#10 | 4.2%(+59.2)#893 |
| 11. | 21056 | 61.7% | 7.4%(+54.3)#11 | 4.2%(+57.5)#996 |
| 12. | 21920 | 59.6% | 7.4%(+52.2)#12 | 4.2%(+55.4)#1,134 |
| 13. | 21082 | 56.5% | 7.4%(+49.1)#13 | 4.2%(+52.3)#1,359 |
| 14. | 21153 | 56.0% | 7.4%(+48.6)#14 | 4.2%(+51.8)#1,393 |
| 15. | 21130 | 52.4% | 7.4%(+45.0)#15 | 4.2%(+48.2)#1,676 |
| 16. | 21667 | 51.2% | 7.4%(+43.8)#16 | 4.2%(+47.0)#1,760 |
| 17. | 21717 | 50.5% | 7.4%(+43.1)#17 | 4.2%(+46.3)#1,808 |
| 18. | 21543 | 49.4% | 7.4%(+42.0)#18 | 4.2%(+45.2)#1,879 |
| 19. | 21780 | 49.0% | 7.4%(+41.6)#19 | 4.2%(+44.8)#1,897 |
| 20. | 20868 | 47.4% | 7.4%(+40.0)#20 | 4.2%(+43.2)#2,022 |
| 21. | 20838 | 47.4% | 7.4%(+40.0)#21 | 4.2%(+43.2)#2,023 |
| 22. | 21155 | 46.9% | 7.4%(+39.5)#22 | 4.2%(+42.7)#2,049 |
| 23. | 21672 | 46.2% | 7.4%(+38.8)#23 | 4.2%(+42.0)#2,098 |
| 24. | 20842 | 45.8% | 7.4%(+38.4)#24 | 4.2%(+41.6)#2,113 |
| 25. | 20624 | 44.6% | 7.4%(+37.2)#25 | 4.2%(+40.4)#2,212 |
| 26. | 21160 | 43.9% | 7.4%(+36.5)#26 | 4.2%(+39.7)#2,261 |
| 27. | 21626 | 41.9% | 7.4%(+34.5)#27 | 4.2%(+37.7)#2,416 |
| 28. | 21087 | 41.6% | 7.4%(+34.2)#28 | 4.2%(+37.4)#2,435 |
| 29. | 21872 | 41.3% | 7.4%(+33.9)#29 | 4.2%(+37.1)#2,461 |
| 30. | 20609 | 40.9% | 7.4%(+33.5)#30 | 4.2%(+36.7)#2,504 |
| 31. | 21869 | 40.7% | 7.4%(+33.3)#31 | 4.2%(+36.5)#2,519 |
| 32. | 20617 | 40.6% | 7.4%(+33.2)#32 | 4.2%(+36.4)#2,527 |
| 33. | 21733 | 40.5% | 7.4%(+33.1)#33 | 4.2%(+36.3)#2,534 |
| 34. | 21711 | 40.4% | 7.4%(+33.0)#34 | 4.2%(+36.2)#2,539 |
| 35. | 21622 | 40.2% | 7.4%(+32.8)#35 | 4.2%(+36.0)#2,554 |
| 36. | 20618 | 40.0% | 7.4%(+32.6)#36 | 4.2%(+35.8)#2,571 |
| 37. | 21023 | 40.0% | 7.4%(+32.6)#37 | 4.2%(+35.8)#2,578 |
| 38. | 20622 | 39.3% | 7.4%(+31.9)#38 | 4.2%(+35.1)#2,624 |
| 39. | 21634 | 38.5% | 7.4%(+31.1)#39 | 4.2%(+34.3)#2,678 |
| 40. | 21057 | 38.2% | 7.4%(+30.8)#40 | 4.2%(+34.0)#2,693 |
| 41. | 21866 | 37.9% | 7.4%(+30.5)#41 | 4.2%(+33.7)#2,726 |
| 42. | 21034 | 37.1% | 7.4%(+29.7)#42 | 4.2%(+32.9)#2,780 |
| 43. | 21531 | 37.1% | 7.4%(+29.7)#43 | 4.2%(+32.9)#2,781 |
| 44. | 21111 | 36.9% | 7.4%(+29.5)#44 | 4.2%(+32.7)#2,801 |
| 45. | 21161 | 36.6% | 7.4%(+29.2)#45 | 4.2%(+32.4)#2,820 |
| 46. | 21791 | 36.6% | 7.4%(+29.2)#46 | 4.2%(+32.4)#2,822 |
| 47. | 20675 | 36.5% | 7.4%(+29.1)#47 | 4.2%(+32.3)#2,834 |
| 48. | 21641 | 36.1% | 7.4%(+28.7)#48 | 4.2%(+31.9)#2,860 |
| 49. | 21520 | 35.6% | 7.4%(+28.2)#49 | 4.2%(+31.4)#2,891 |
| 50. | 21914 | 34.9% | 7.4%(+27.5)#50 | 4.2%(+30.7)#2,964 |
| 51. | 20880 | 34.7% | 7.4%(+27.3)#51 | 4.2%(+30.5)#2,981 |
| 52. | 21084 | 33.3% | 7.4%(+25.9)#52 | 4.2%(+29.1)#3,073 |
| 53. | 21612 | 33.1% | 7.4%(+25.7)#53 | 4.2%(+28.9)#3,095 |
| 54. | 20658 | 32.0% | 7.4%(+24.6)#54 | 4.2%(+27.8)#3,174 |
| 55. | 20606 | 32.0% | 7.4%(+24.6)#55 | 4.2%(+27.8)#3,176 |
| 56. | 21659 | 31.9% | 7.4%(+24.5)#56 | 4.2%(+27.7)#3,187 |
| 57. | 21911 | 31.8% | 7.4%(+24.4)#57 | 4.2%(+27.6)#3,192 |
| 58. | 21047 | 31.4% | 7.4%(+24.0)#58 | 4.2%(+27.2)#3,223 |
| 59. | 20765 | 31.2% | 7.4%(+23.8)#59 | 4.2%(+27.0)#3,249 |
| 60. | 21766 | 30.8% | 7.4%(+23.4)#60 | 4.2%(+26.6)#3,277 |
| 61. | 21776 | 30.7% | 7.4%(+23.3)#61 | 4.2%(+26.5)#3,282 |
| 62. | 21013 | 30.7% | 7.4%(+23.3)#62 | 4.2%(+26.5)#3,283 |
| 63. | 21917 | 30.6% | 7.4%(+23.2)#63 | 4.2%(+26.4)#3,292 |
| 64. | 21645 | 30.5% | 7.4%(+23.1)#64 | 4.2%(+26.3)#3,299 |
| 65. | 21131 | 30.4% | 7.4%(+23.0)#65 | 4.2%(+26.2)#3,303 |
| 66. | 21657 | 29.7% | 7.4%(+22.3)#66 | 4.2%(+25.5)#3,358 |
| 67. | 21545 | 29.4% | 7.4%(+22.0)#67 | 4.2%(+25.2)#3,377 |
| 68. | 21915 | 28.3% | 7.4%(+20.9)#68 | 4.2%(+24.1)#3,465 |
| 69. | 21561 | 28.2% | 7.4%(+20.8)#69 | 4.2%(+24.0)#3,475 |
| 70. | 21912 | 28.2% | 7.4%(+20.8)#70 | 4.2%(+24.0)#3,477 |
| 71. | 20779 | 28.1% | 7.4%(+20.7)#71 | 4.2%(+23.9)#3,487 |
| 72. | 21783 | 27.9% | 7.4%(+20.5)#72 | 4.2%(+23.7)#3,508 |
| 73. | 21861 | 27.8% | 7.4%(+20.4)#73 | 4.2%(+23.6)#3,530 |
| 74. | 21102 | 27.6% | 7.4%(+20.2)#74 | 4.2%(+23.4)#3,543 |
| 75. | 21541 | 27.6% | 7.4%(+20.2)#75 | 4.2%(+23.4)#3,545 |
| 76. | 20640 | 27.5% | 7.4%(+20.1)#76 | 4.2%(+23.3)#3,551 |
| 77. | 21162 | 27.4% | 7.4%(+20.0)#77 | 4.2%(+23.2)#3,557 |
| 78. | 21071 | 26.9% | 7.4%(+19.5)#78 | 4.2%(+22.7)#3,599 |
| 79. | 21132 | 26.3% | 7.4%(+18.9)#79 | 4.2%(+22.1)#3,649 |
| 80. | 21795 | 26.2% | 7.4%(+18.8)#80 | 4.2%(+22.0)#3,655 |
| 81. | 21053 | 26.2% | 7.4%(+18.8)#81 | 4.2%(+22.0)#3,658 |
| 82. | 21758 | 26.1% | 7.4%(+18.7)#82 | 4.2%(+21.9)#3,666 |
| 83. | 21530 | 26.0% | 7.4%(+18.6)#83 | 4.2%(+21.8)#3,677 |
| 84. | 20608 | 25.8% | 7.4%(+18.4)#84 | 4.2%(+21.6)#3,694 |
| 85. | 21120 | 25.7% | 7.4%(+18.3)#85 | 4.2%(+21.5)#3,696 |
| 86. | 21856 | 25.7% | 7.4%(+18.3)#86 | 4.2%(+21.5)#3,702 |
| 87. | 20636 | 25.6% | 7.4%(+18.2)#87 | 4.2%(+21.4)#3,707 |
| 88. | 21722 | 25.6% | 7.4%(+18.2)#88 | 4.2%(+21.4)#3,709 |
| 89. | 21904 | 25.2% | 7.4%(+17.8)#89 | 4.2%(+21.0)#3,751 |
| 90. | 20754 | 25.0% | 7.4%(+17.6)#90 | 4.2%(+20.8)#3,772 |
| 91. | 21624 | 25.0% | 7.4%(+17.6)#91 | 4.2%(+20.8)#3,782 |
| 92. | 20711 | 24.8% | 7.4%(+17.4)#92 | 4.2%(+20.6)#3,794 |
| 93. | 21750 | 24.8% | 7.4%(+17.4)#93 | 4.2%(+20.6)#3,795 |
| 94. | 20777 | 24.8% | 7.4%(+17.4)#94 | 4.2%(+20.6)#3,796 |
| 95. | 21651 | 24.6% | 7.4%(+17.2)#95 | 4.2%(+20.4)#3,810 |
| 96. | 21757 | 24.5% | 7.4%(+17.1)#96 | 4.2%(+20.3)#3,820 |
| 97. | 21788 | 24.2% | 7.4%(+16.8)#97 | 4.2%(+20.0)#3,842 |
| 98. | 21032 | 23.9% | 7.4%(+16.5)#98 | 4.2%(+19.7)#3,873 |
| 99. | 21048 | 23.7% | 7.4%(+16.3)#99 | 4.2%(+19.5)#3,894 |
| 100. | 21756 | 23.7% | 7.4%(+16.3)#100 | 4.2%(+19.5)#3,898 |
Common Questions
What are the Top 10 Zip Codes with the Highest Percentage of Households Heated by Fuel Oil / Kerosene in Maryland?
Top 10 Zip Codes with the Highest Percentage of Households Heated by Fuel Oil / Kerosene in Maryland are:
What zip code has the Highest Percentage of Households Heated by Fuel Oil / Kerosene in Maryland?
20656 has the Highest Percentage of Households Heated by Fuel Oil / Kerosene in Maryland with 100.0%.
What is the Percentage of Households Heated by Fuel Oil / Kerosene in the State of Maryland?
Percentage of Households Heated by Fuel Oil / Kerosene in Maryland is 7.4%.
What is the Percentage of Households Heated by Fuel Oil / Kerosene in the United States?
Percentage of Households Heated by Fuel Oil / Kerosene in the United States is 4.2%.