Zip Codes with the Highest Percentage of Population with a Degree in Arts and Humanities in Maryland
RELATED REPORTS & OPTIONS
Arts and Humanities
Maryland
Compare Zip Codes
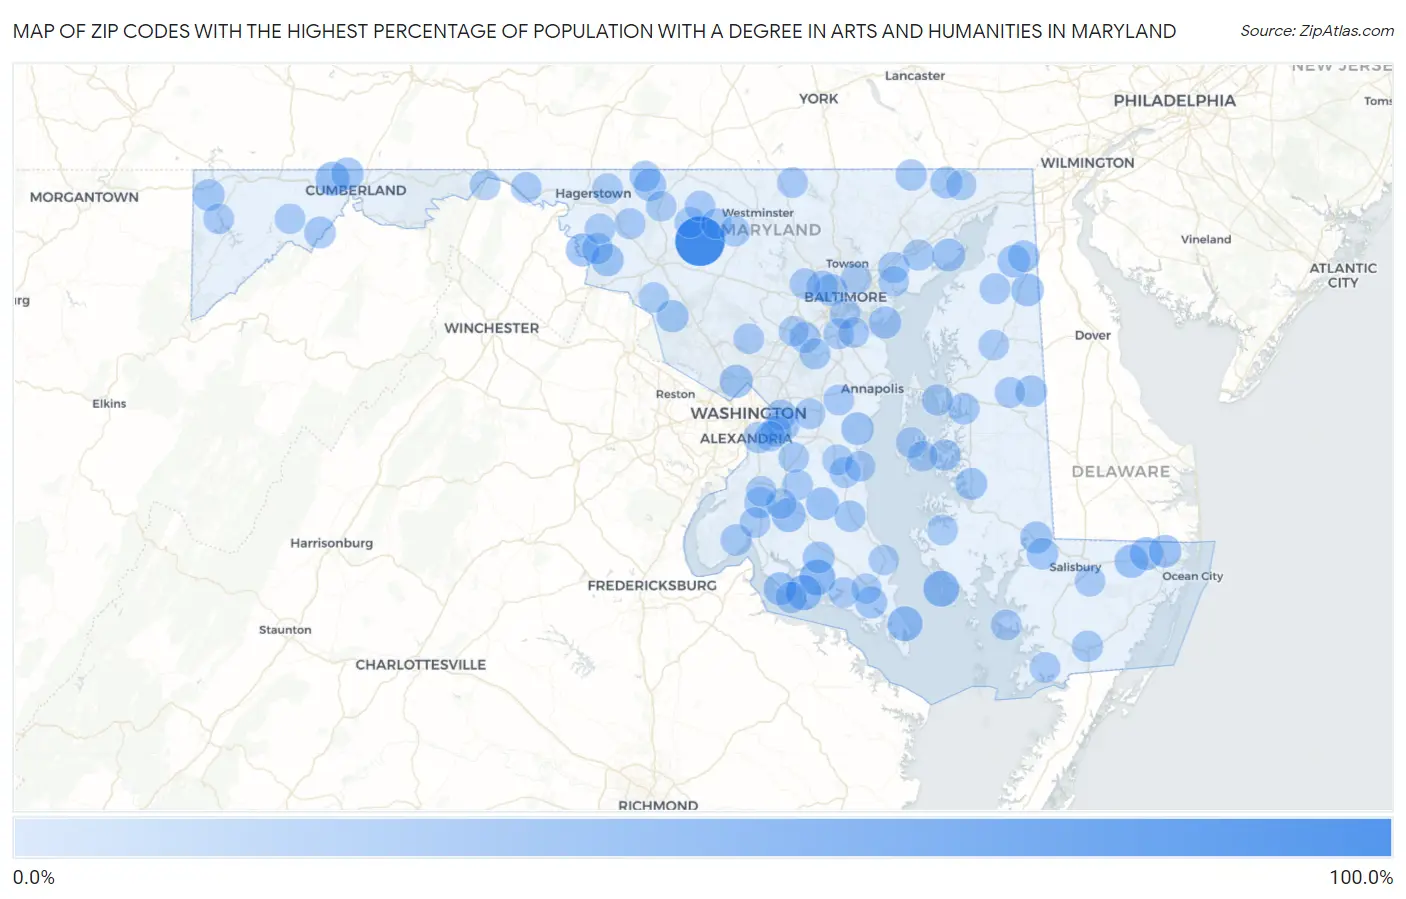
Map of Zip Codes with the Highest Percentage of Population with a Degree in Arts and Humanities in Maryland
0.0%
100.0%
Zip Codes with the Highest Percentage of Population with a Degree in Arts and Humanities in Maryland
| Zip Code | % Graduates | vs State | vs National | |
| 1. | 21762 | 100.0% | 5.9%(+94.1)#1 | 6.0%(+94.0)#46 |
| 2. | 21634 | 34.7% | 5.9%(+28.8)#2 | 6.0%(+28.7)#481 |
| 3. | 20624 | 34.3% | 5.9%(+28.4)#3 | 6.0%(+28.3)#488 |
| 4. | 20618 | 32.1% | 5.9%(+26.2)#4 | 6.0%(+26.1)#579 |
| 5. | 20628 | 29.6% | 5.9%(+23.7)#5 | 6.0%(+23.7)#674 |
| 6. | 20617 | 25.7% | 5.9%(+19.8)#6 | 6.0%(+19.7)#909 |
| 7. | 21545 | 25.1% | 5.9%(+19.2)#7 | 6.0%(+19.1)#941 |
| 8. | 21874 | 22.1% | 5.9%(+16.2)#8 | 6.0%(+16.1)#1,215 |
| 9. | 20889 | 21.7% | 5.9%(+15.8)#9 | 6.0%(+15.7)#1,266 |
| 10. | 20608 | 21.5% | 5.9%(+15.6)#10 | 6.0%(+15.5)#1,289 |
| 11. | 21782 | 21.3% | 5.9%(+15.4)#11 | 6.0%(+15.3)#1,309 |
| 12. | 21872 | 20.9% | 5.9%(+15.0)#12 | 6.0%(+14.9)#1,356 |
| 13. | 20645 | 20.9% | 5.9%(+15.0)#13 | 6.0%(+14.9)#1,364 |
| 14. | 21005 | 20.4% | 5.9%(+14.5)#14 | 6.0%(+14.4)#1,436 |
| 15. | 21650 | 19.4% | 5.9%(+13.5)#15 | 6.0%(+13.4)#1,584 |
| 16. | 21779 | 19.0% | 5.9%(+13.1)#16 | 6.0%(+13.0)#1,656 |
| 17. | 20778 | 18.9% | 5.9%(+13.0)#17 | 6.0%(+12.9)#1,661 |
| 18. | 21813 | 18.9% | 5.9%(+13.0)#18 | 6.0%(+12.9)#1,670 |
| 19. | 21913 | 18.1% | 5.9%(+12.2)#19 | 6.0%(+12.1)#1,819 |
| 20. | 21524 | 18.1% | 5.9%(+12.2)#20 | 6.0%(+12.1)#1,829 |
| 21. | 21780 | 17.5% | 5.9%(+11.6)#21 | 6.0%(+11.5)#1,964 |
| 22. | 21052 | 17.2% | 5.9%(+11.3)#22 | 6.0%(+11.2)#2,041 |
| 23. | 20838 | 17.1% | 5.9%(+11.2)#23 | 6.0%(+11.1)#2,050 |
| 24. | 21837 | 16.4% | 5.9%(+10.5)#24 | 6.0%(+10.4)#2,242 |
| 25. | 20634 | 16.1% | 5.9%(+10.2)#25 | 6.0%(+10.1)#2,314 |
| 26. | 21673 | 16.0% | 5.9%(+10.1)#26 | 6.0%(+10.0)#2,332 |
| 27. | 21216 | 16.0% | 5.9%(+10.1)#27 | 6.0%(+10.0)#2,337 |
| 28. | 21531 | 15.9% | 5.9%(+10.00)#28 | 6.0%(+9.91)#2,372 |
| 29. | 20659 | 15.7% | 5.9%(+9.82)#29 | 6.0%(+9.73)#2,415 |
| 30. | 21918 | 15.1% | 5.9%(+9.15)#30 | 6.0%(+9.06)#2,652 |
| 31. | 21830 | 15.1% | 5.9%(+9.15)#31 | 6.0%(+9.06)#2,655 |
| 32. | 21557 | 15.0% | 5.9%(+9.06)#32 | 6.0%(+8.97)#2,691 |
| 33. | 21679 | 14.7% | 5.9%(+8.78)#33 | 6.0%(+8.69)#2,803 |
| 34. | 20747 | 14.4% | 5.9%(+8.53)#34 | 6.0%(+8.44)#2,909 |
| 35. | 21639 | 14.3% | 5.9%(+8.43)#35 | 6.0%(+8.33)#2,955 |
| 36. | 21912 | 14.0% | 5.9%(+8.11)#36 | 6.0%(+8.02)#3,122 |
| 37. | 20693 | 13.9% | 5.9%(+7.98)#37 | 6.0%(+7.88)#3,185 |
| 38. | 20678 | 13.7% | 5.9%(+7.80)#38 | 6.0%(+7.71)#3,260 |
| 39. | 20695 | 13.5% | 5.9%(+7.56)#39 | 6.0%(+7.46)#3,384 |
| 40. | 21756 | 13.4% | 5.9%(+7.55)#40 | 6.0%(+7.45)#3,390 |
| 41. | 20745 | 13.1% | 5.9%(+7.21)#41 | 6.0%(+7.12)#3,569 |
| 42. | 20625 | 13.1% | 5.9%(+7.21)#42 | 6.0%(+7.12)#3,574 |
| 43. | 21160 | 13.1% | 5.9%(+7.20)#43 | 6.0%(+7.10)#3,582 |
| 44. | 21851 | 12.9% | 5.9%(+6.99)#44 | 6.0%(+6.90)#3,711 |
| 45. | 21162 | 12.9% | 5.9%(+6.96)#45 | 6.0%(+6.86)#3,738 |
| 46. | 21207 | 12.8% | 5.9%(+6.88)#46 | 6.0%(+6.79)#3,778 |
| 47. | 21653 | 12.5% | 5.9%(+6.60)#47 | 6.0%(+6.50)#3,994 |
| 48. | 21040 | 12.2% | 5.9%(+6.32)#48 | 6.0%(+6.22)#4,168 |
| 49. | 21638 | 12.2% | 5.9%(+6.29)#49 | 6.0%(+6.20)#4,187 |
| 50. | 21719 | 12.1% | 5.9%(+6.16)#50 | 6.0%(+6.06)#4,275 |
| 51. | 20794 | 12.0% | 5.9%(+6.08)#51 | 6.0%(+5.99)#4,323 |
| 52. | 20755 | 11.9% | 5.9%(+5.96)#52 | 6.0%(+5.87)#4,406 |
| 53. | 20743 | 11.7% | 5.9%(+5.75)#53 | 6.0%(+5.66)#4,572 |
| 54. | 21798 | 11.4% | 5.9%(+5.53)#54 | 6.0%(+5.43)#4,741 |
| 55. | 20736 | 11.4% | 5.9%(+5.50)#55 | 6.0%(+5.41)#4,767 |
| 56. | 21773 | 11.4% | 5.9%(+5.50)#56 | 6.0%(+5.40)#4,776 |
| 57. | 21214 | 11.3% | 5.9%(+5.43)#57 | 6.0%(+5.33)#4,846 |
| 58. | 21645 | 11.3% | 5.9%(+5.39)#58 | 6.0%(+5.30)#4,873 |
| 59. | 21677 | 11.0% | 5.9%(+5.12)#59 | 6.0%(+5.03)#5,124 |
| 60. | 20746 | 10.9% | 5.9%(+5.04)#60 | 6.0%(+4.95)#5,182 |
| 61. | 20754 | 10.8% | 5.9%(+4.93)#61 | 6.0%(+4.84)#5,282 |
| 62. | 21757 | 10.8% | 5.9%(+4.89)#62 | 6.0%(+4.80)#5,319 |
| 63. | 21244 | 10.6% | 5.9%(+4.66)#63 | 6.0%(+4.56)#5,574 |
| 64. | 20613 | 10.5% | 5.9%(+4.61)#64 | 6.0%(+4.52)#5,627 |
| 65. | 21102 | 10.3% | 5.9%(+4.38)#65 | 6.0%(+4.28)#5,888 |
| 66. | 21035 | 10.2% | 5.9%(+4.35)#66 | 6.0%(+4.25)#5,937 |
| 67. | 21821 | 10.2% | 5.9%(+4.33)#67 | 6.0%(+4.23)#5,950 |
| 68. | 20774 | 10.2% | 5.9%(+4.32)#68 | 6.0%(+4.22)#5,960 |
| 69. | 21838 | 10.2% | 5.9%(+4.30)#69 | 6.0%(+4.20)#5,982 |
| 70. | 21660 | 10.2% | 5.9%(+4.28)#70 | 6.0%(+4.19)#5,998 |
| 71. | 21791 | 10.2% | 5.9%(+4.27)#71 | 6.0%(+4.17)#6,025 |
| 72. | 20646 | 10.2% | 5.9%(+4.26)#72 | 6.0%(+4.16)#6,037 |
| 73. | 21061 | 10.2% | 5.9%(+4.25)#73 | 6.0%(+4.16)#6,049 |
| 74. | 21541 | 10.1% | 5.9%(+4.21)#74 | 6.0%(+4.12)#6,100 |
| 75. | 20714 | 10.1% | 5.9%(+4.17)#75 | 6.0%(+4.07)#6,152 |
| 76. | 21711 | 10.0% | 5.9%(+4.10)#76 | 6.0%(+4.00)#6,244 |
| 77. | 20860 | 10.0% | 5.9%(+4.09)#77 | 6.0%(+3.99)#6,281 |
| 78. | 21225 | 9.9% | 5.9%(+3.99)#78 | 6.0%(+3.90)#6,392 |
| 79. | 21060 | 9.9% | 5.9%(+3.99)#79 | 6.0%(+3.89)#6,404 |
| 80. | 21623 | 9.9% | 5.9%(+3.98)#80 | 6.0%(+3.88)#6,422 |
| 81. | 21804 | 9.9% | 5.9%(+3.98)#81 | 6.0%(+3.88)#6,424 |
| 82. | 21665 | 9.8% | 5.9%(+3.90)#82 | 6.0%(+3.81)#6,523 |
| 83. | 20650 | 9.8% | 5.9%(+3.88)#83 | 6.0%(+3.79)#6,549 |
| 84. | 20623 | 9.7% | 5.9%(+3.81)#84 | 6.0%(+3.71)#6,642 |
| 85. | 21710 | 9.6% | 5.9%(+3.69)#85 | 6.0%(+3.59)#6,803 |
| 86. | 21742 | 9.6% | 5.9%(+3.68)#86 | 6.0%(+3.59)#6,807 |
| 87. | 20602 | 9.6% | 5.9%(+3.66)#87 | 6.0%(+3.57)#6,842 |
| 88. | 21612 | 9.4% | 5.9%(+3.49)#88 | 6.0%(+3.39)#7,103 |
| 89. | 21713 | 9.4% | 5.9%(+3.46)#89 | 6.0%(+3.37)#7,141 |
| 90. | 20603 | 9.4% | 5.9%(+3.46)#90 | 6.0%(+3.37)#7,148 |
| 91. | 21750 | 9.3% | 5.9%(+3.38)#91 | 6.0%(+3.29)#7,264 |
| 92. | 20748 | 9.1% | 5.9%(+3.19)#92 | 6.0%(+3.09)#7,614 |
| 93. | 21220 | 9.1% | 5.9%(+3.17)#93 | 6.0%(+3.07)#7,643 |
| 94. | 21788 | 9.0% | 5.9%(+3.13)#94 | 6.0%(+3.04)#7,690 |
| 95. | 21521 | 9.0% | 5.9%(+3.11)#95 | 6.0%(+3.02)#7,719 |
| 96. | 21776 | 9.0% | 5.9%(+3.08)#96 | 6.0%(+2.98)#7,784 |
| 97. | 20619 | 8.9% | 5.9%(+2.96)#97 | 6.0%(+2.87)#7,959 |
| 98. | 21917 | 8.8% | 5.9%(+2.85)#98 | 6.0%(+2.76)#8,161 |
| 99. | 21046 | 8.7% | 5.9%(+2.84)#99 | 6.0%(+2.75)#8,178 |
| 100. | 20657 | 8.7% | 5.9%(+2.81)#100 | 6.0%(+2.71)#8,247 |
Common Questions
What are the Top 10 Zip Codes with the Highest Percentage of Population with a Degree in Arts and Humanities in Maryland?
Top 10 Zip Codes with the Highest Percentage of Population with a Degree in Arts and Humanities in Maryland are:
What zip code has the Highest Percentage of Population with a Degree in Arts and Humanities in Maryland?
21762 has the Highest Percentage of Population with a Degree in Arts and Humanities in Maryland with 100.0%.
What is the Percentage of Population with a Degree in Arts and Humanities in the State of Maryland?
Percentage of Population with a Degree in Arts and Humanities in Maryland is 5.9%.
What is the Percentage of Population with a Degree in Arts and Humanities in the United States?
Percentage of Population with a Degree in Arts and Humanities in the United States is 6.0%.