Zip Codes with the Highest Percentage of Population with a Degree in Literature and Languages in Indianapolis, IN

RELATED REPORTS & OPTIONS

Literature and Languages
Population
Families and Households
Female Fertility
Female Fertility (Unmarried)
Race (Community Size)
Race (Percentage)
Ancestry (Community Size)
AfghanAfricanAlaskan AthabascanAlbanianAlsatianAmericanApacheArabArgentineanArmenianAustralianAustrianBahamianBangladeshiBarbadianBasqueBelgianBelizeanBhutaneseBlackfeetBolivianBrazilianBritishBritish West IndianBulgarianBurmeseCajunCanadianCelticCentral AmericanCentral American IndianCherokeeChickasawChileanChippewaChoctawColombianCosta RicanCroatianCrowCubanCzechCzechoslovakianDanishDominicanDutchEastern EuropeanEcuadorianEgyptianEnglishEstonianEthiopianEuropeanFilipinoFinnishFrenchFrench CanadianGermanGerman RussianGhanaianGreekGuamanian / ChamorroGuatemalanGuyaneseHaitianHonduranHopiHungarianIcelanderIndian (Asian)IndonesianInupiatIranianIraqiIrishIroquoisIsraeliItalianJamaicanJapaneseJordanianKenyanKoreanLaotianLatvianLebaneseLiberianLithuanianLuxembourgerMacedonianMalaysianMenomineeMexicanMexican American IndianMongolianMoroccanNative HawaiianNavajoNew ZealanderNicaraguanNigerianNorthern EuropeanNorwegianPakistaniPalestinianPanamanianPennsylvania GermanPeruvianPolishPortuguesePotawatomiPuerto RicanRomanianRussianSalvadoranSamoanScandinavianScotch-IrishScottishSeminoleSenegaleseSerbianSierra LeoneanSiouxSlavicSlovakSloveneSouth AfricanSouth AmericanSouth American IndianSpaniardSpanishSri LankanSubsaharan AfricanSudaneseSwedishSwissSyrianThaiTonganTrinidadian and TobagonianTurkishUgandanUkrainianUruguayanVenezuelanVietnameseWelshWest IndianYugoslavianZimbabwean
Ancestry (Percentage)
AfghanAfricanAlaskan AthabascanAlbanianAlsatianAmericanApacheArabArgentineanArmenianAustralianAustrianBahamianBangladeshiBarbadianBasqueBelgianBelizeanBhutaneseBlackfeetBolivianBrazilianBritishBritish West IndianBulgarianBurmeseCajunCanadianCelticCentral AmericanCentral American IndianCherokeeChickasawChileanChippewaChoctawColombianCosta RicanCroatianCrowCubanCzechCzechoslovakianDanishDominicanDutchEastern EuropeanEcuadorianEgyptianEnglishEstonianEthiopianEuropeanFilipinoFinnishFrenchFrench CanadianGermanGerman RussianGhanaianGreekGuamanian / ChamorroGuatemalanGuyaneseHaitianHonduranHopiHungarianIcelanderIndian (Asian)IndonesianInupiatIranianIraqiIrishIroquoisIsraeliItalianJamaicanJapaneseJordanianKenyanKoreanLaotianLatvianLebaneseLiberianLithuanianLuxembourgerMacedonianMalaysianMenomineeMexicanMexican American IndianMongolianMoroccanNative HawaiianNavajoNew ZealanderNicaraguanNigerianNorthern EuropeanNorwegianPakistaniPalestinianPanamanianPennsylvania GermanPeruvianPolishPortuguesePotawatomiPuerto RicanRomanianRussianSalvadoranSamoanScandinavianScotch-IrishScottishSeminoleSenegaleseSerbianSierra LeoneanSiouxSlavicSlovakSloveneSouth AfricanSouth AmericanSouth American IndianSpaniardSpanishSri LankanSubsaharan AfricanSudaneseSwedishSwissSyrianThaiTonganTrinidadian and TobagonianTurkishUgandanUkrainianUruguayanVenezuelanVietnameseWelshWest IndianYugoslavianZimbabwean
Immigrant Origin (Total)
AfghanistanAfricaArgentinaAsiaAustraliaAustriaBahamasBangladeshBarbadosBelarusBoliviaBosnia and HerzegovinaBrazilBulgariaBurma / MyanmarCambodiaCameroonCanadaCaribbeanCentral AmericaChileChinaColombiaCongoCosta RicaCubaDenmarkDominican RepublicEastern AfricaEastern AsiaEastern EuropeEcuadorEgyptEl SalvadorEnglandEritreaEthiopiaEuropeFranceGermanyGhanaGreeceGuatemalaGuyanaHaitiHondurasHong KongHungaryIndiaIndonesiaIranIraqIrelandIsraelItalyJamaicaJapanJordanKenyaKoreaLaosLatin AmericaLatviaLebanonLiberiaMalaysiaMexicoMiddle AfricaMoldovaMoroccoNepalNetherlandsNicaraguaNigeriaNorth MacedoniaNorthern AfricaNorthern EuropeNorwayOceaniaPakistanPanamaPeruPhilippinesPolandPortugalRomaniaRussiaSaudi ArabiaScotlandSenegalSerbiaSierra LeoneSingaporeSouth AfricaSouth AmericaSouth Central AsiaSouth Eastern AsiaSouthern EuropeSpainSt. Vincent and the GrenadinesSudanSyriaTaiwanThailandTrinidad and TobagoTurkeyUgandaUkraineUzbekistanVenezuelaVietnamWest IndiesWestern AfricaWestern AsiaWestern EuropeYemenZaireZimbabwe
Immigrant Origin (Percentage)
AfghanistanAfricaArgentinaAsiaAustraliaAustriaBahamasBangladeshBarbadosBelarusBoliviaBosnia and HerzegovinaBrazilBulgariaBurma / MyanmarCambodiaCameroonCanadaCaribbeanCentral AmericaChileChinaColombiaCongoCosta RicaCubaDenmarkDominican RepublicEastern AfricaEastern AsiaEastern EuropeEcuadorEgyptEl SalvadorEnglandEritreaEthiopiaEuropeFranceGermanyGhanaGreeceGuatemalaGuyanaHaitiHondurasHong KongHungaryIndiaIndonesiaIranIraqIrelandIsraelItalyJamaicaJapanJordanKenyaKoreaLaosLatin AmericaLatviaLebanonLiberiaMalaysiaMexicoMiddle AfricaMoldovaMoroccoNepalNetherlandsNicaraguaNigeriaNorth MacedoniaNorthern AfricaNorthern EuropeNorwayOceaniaPakistanPanamaPeruPhilippinesPolandPortugalRomaniaRussiaSaudi ArabiaScotlandSenegalSerbiaSierra LeoneSingaporeSouth AfricaSouth AmericaSouth Central AsiaSouth Eastern AsiaSouthern EuropeSpainSt. Vincent and the GrenadinesSudanSyriaTaiwanThailandTrinidad and TobagoTurkeyUgandaUkraineUzbekistanVenezuelaVietnamWest IndiesWestern AfricaWestern AsiaWestern EuropeYemenZaireZimbabwe
Income
Income (Families)
Income (Households)
Poverty
Poverty (Families)
Unemployment
Employment Occupations
Employment Industries
Employer Class
Commute Time
Commute Means
School Enrollment
Education by Degree Field
Occupancy
Finances
Physical Characteristics
Indianapolis
Compare Zip Codes
Comparison Subject

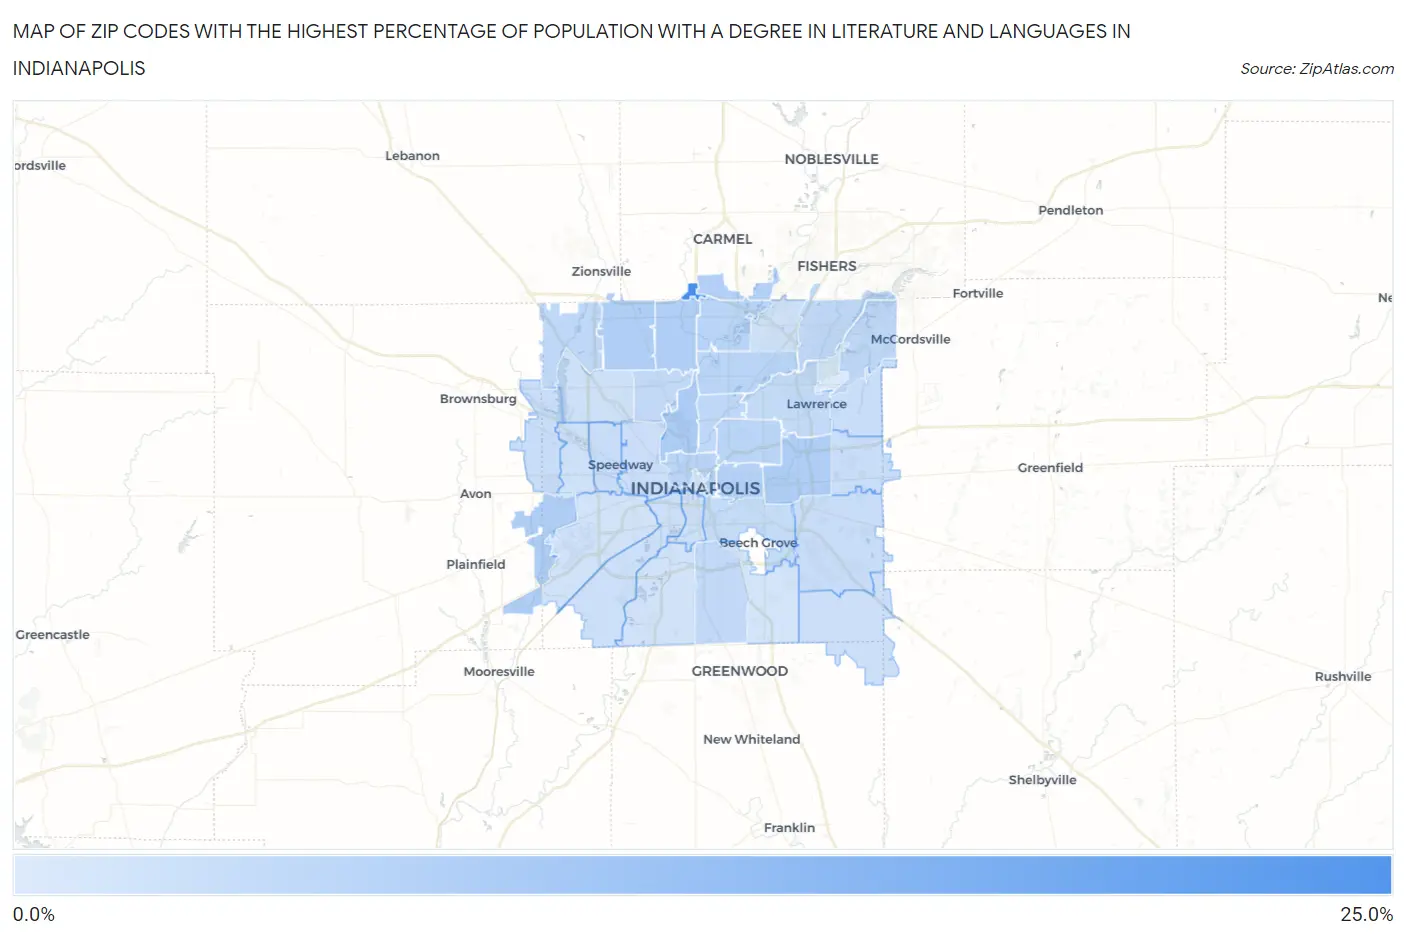
Map of Zip Codes with the Highest Percentage of Population with a Degree in Literature and Languages in Indianapolis

0.0%
25.0%
Zip Codes with the Highest Percentage of Population with a Degree in Literature and Languages in Indianapolis Map

Zip Codes with the Highest Percentage of Population with a Degree in Literature and Languages in Indianapolis, IN

Zip Code % Graduates vs State vs National
1.4629021.1%3.4%(+17.7)#64.4%(+16.7)#430
2.462087.3%3.4%(+3.85)#504.4%(+2.86)#3,689
3.462316.9%3.4%(+3.48)#544.4%(+2.49)#4,107
4.462196.7%3.4%(+3.24)#574.4%(+2.26)#4,414
5.462606.4%3.4%(+3.03)#614.4%(+2.04)#4,725
6.462686.4%3.4%(+3.01)#634.4%(+2.03)#4,738
7.462806.1%3.4%(+2.71)#714.4%(+1.72)#5,216
8.462016.0%3.4%(+2.59)#764.4%(+1.60)#5,402
9.462185.5%3.4%(+2.07)#884.4%(+1.08)#6,326
10.462205.4%3.4%(+1.94)#914.4%(+0.954)#6,594
11.462025.4%3.4%(+1.94)#934.4%(+0.949)#6,601
12.462405.3%3.4%(+1.87)#1004.4%(+0.881)#6,751
13.462364.9%3.4%(+1.47)#1224.4%(+0.485)#7,637
14.462054.8%3.4%(+1.41)#1254.4%(+0.419)#7,822
15.462784.7%3.4%(+1.24)#1344.4%(+0.249)#8,268
16.462284.6%3.4%(+1.16)#1354.4%(+0.168)#8,497
17.462274.6%3.4%(+1.14)#1404.4%(+0.149)#8,550
18.462564.5%3.4%(+1.12)#1424.4%(+0.130)#8,618
19.462264.3%3.4%(+0.871)#1494.4%(-0.119)#9,329
20.462033.8%3.4%(+0.386)#1734.4%(-0.603)#10,803
21.462393.7%3.4%(+0.241)#1814.4%(-0.749)#11,295
22.462243.6%3.4%(+0.223)#1824.4%(-0.767)#11,347
23.462293.6%3.4%(+0.146)#1874.4%(-0.844)#11,619
24.462353.6%3.4%(+0.138)#1884.4%(-0.851)#11,640
25.462343.5%3.4%(+0.121)#1894.4%(-0.868)#11,710
26.462223.3%3.4%(-0.092)#2084.4%(-1.08)#12,435
27.462593.1%3.4%(-0.333)#2234.4%(-1.32)#13,261
28.462212.9%3.4%(-0.493)#2324.4%(-1.48)#13,806
29.462142.9%3.4%(-0.541)#2374.4%(-1.53)#13,967
30.462542.8%3.4%(-0.668)#2494.4%(-1.66)#14,444
31.462252.7%3.4%(-0.710)#2514.4%(-1.70)#14,579
32.462502.6%3.4%(-0.781)#2574.4%(-1.77)#14,801
33.462412.4%3.4%(-1.02)#2834.4%(-2.01)#15,660
34.462172.3%3.4%(-1.08)#2894.4%(-2.07)#15,911
35.462042.3%3.4%(-1.12)#2924.4%(-2.11)#16,057
36.462372.2%3.4%(-1.18)#2964.4%(-2.17)#16,268
37.462161.0%3.4%(-2.37)#4054.4%(-3.36)#20,016

Common Questions

What are the Top 10 Zip Codes with the Highest Percentage of Population with a Degree in Literature and Languages in Indianapolis, IN?
Top 10 Zip Codes with the Highest Percentage of Population with a Degree in Literature and Languages in Indianapolis, IN are:
#1
21.1%
#2
7.3%
#3
6.9%
#4
6.7%
#5
6.4%
#6
6.4%
#7
6.1%
#8
6.0%
#9
5.5%
#10
5.4%
What zip code has the Highest Percentage of Population with a Degree in Literature and Languages in Indianapolis, IN?
46290 has the Highest Percentage of Population with a Degree in Literature and Languages in Indianapolis, IN with 21.1%.
What is the Percentage of Population with a Degree in Literature and Languages in Indianapolis, IN?
Percentage of Population with a Degree in Literature and Languages in Indianapolis is 4.4%.
What is the Percentage of Population with a Degree in Literature and Languages in Indiana?
Percentage of Population with a Degree in Literature and Languages in Indiana is 3.4%.
What is the Percentage of Population with a Degree in Literature and Languages in the United States?
Percentage of Population with a Degree in Literature and Languages in the United States is 4.4%.