Zip Codes with the Highest Percentage of Population Employed in Business & Financial in Indianapolis, IN
RELATED REPORTS & OPTIONS
Business & Financial
Indianapolis
Compare Zip Codes
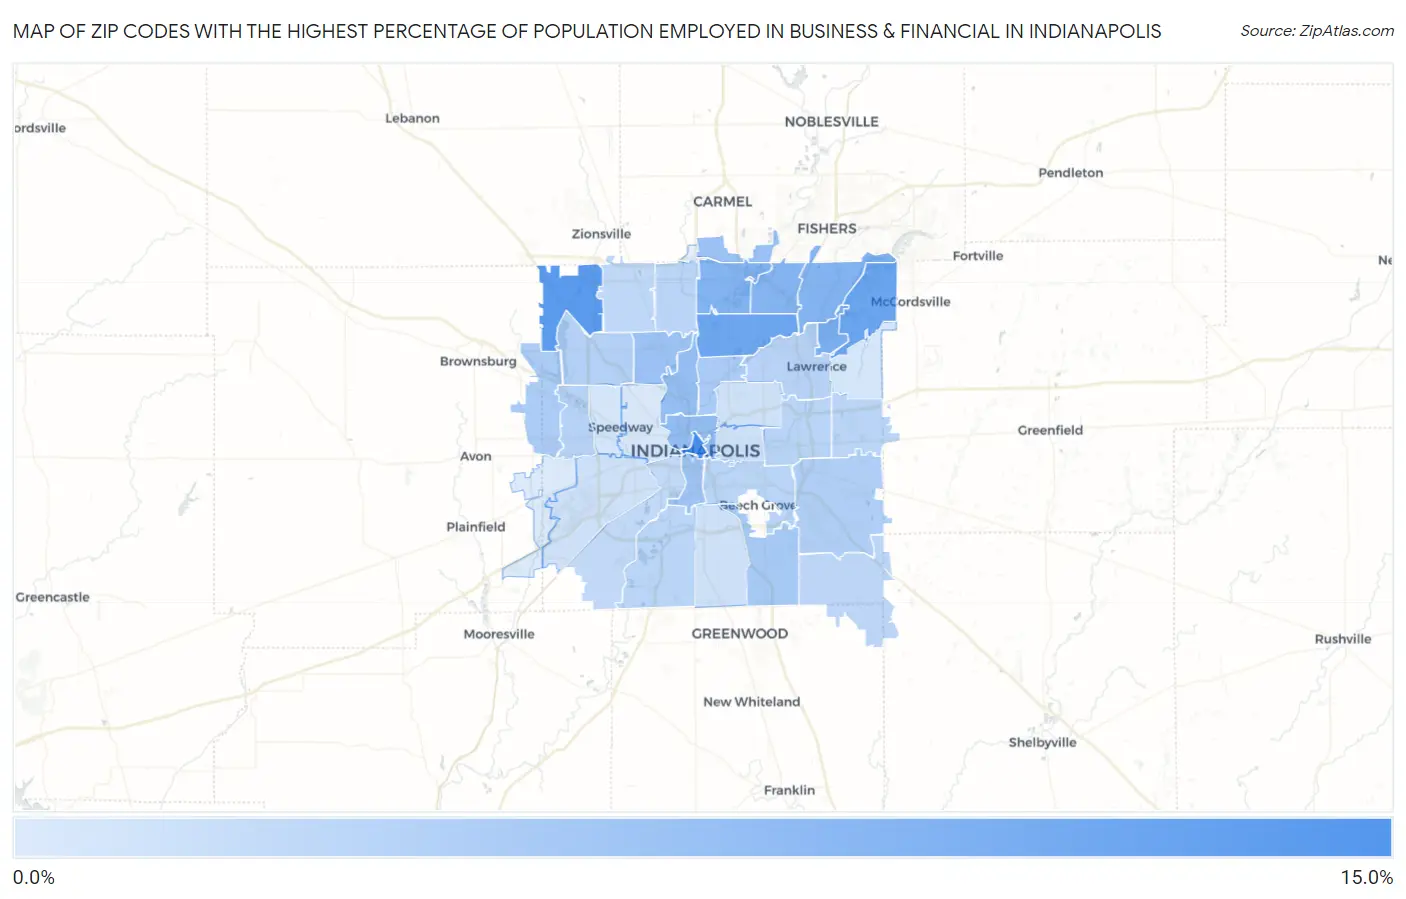
Map of Zip Codes with the Highest Percentage of Population Employed in Business & Financial in Indianapolis
2.9%
14.4%
Zip Codes with the Highest Percentage of Population Employed in Business & Financial in Indianapolis, IN
| Zip Code | % Employed | vs State | vs National | |
| 1. | 46204 | 14.4% | 4.8%(+9.64)#5 | 5.8%(+8.65)#680 |
| 2. | 46278 | 12.7% | 4.8%(+7.91)#12 | 5.8%(+6.92)#1,009 |
| 3. | 46236 | 11.5% | 4.8%(+6.75)#19 | 5.8%(+5.77)#1,400 |
| 4. | 46220 | 11.2% | 4.8%(+6.42)#22 | 5.8%(+5.43)#1,560 |
| 5. | 46216 | 10.1% | 4.8%(+5.32)#27 | 5.8%(+4.34)#2,126 |
| 6. | 46240 | 9.6% | 4.8%(+4.80)#34 | 5.8%(+3.81)#2,559 |
| 7. | 46250 | 9.4% | 4.8%(+4.66)#37 | 5.8%(+3.67)#2,692 |
| 8. | 46256 | 9.4% | 4.8%(+4.65)#38 | 5.8%(+3.66)#2,700 |
| 9. | 46202 | 8.4% | 4.8%(+3.61)#46 | 5.8%(+2.62)#3,739 |
| 10. | 46208 | 8.2% | 4.8%(+3.45)#47 | 5.8%(+2.47)#3,942 |
| 11. | 46228 | 7.9% | 4.8%(+3.14)#55 | 5.8%(+2.15)#4,365 |
| 12. | 46280 | 7.6% | 4.8%(+2.83)#64 | 5.8%(+1.85)#4,804 |
| 13. | 46225 | 7.4% | 4.8%(+2.62)#67 | 5.8%(+1.63)#5,149 |
| 14. | 46237 | 6.7% | 4.8%(+1.96)#87 | 5.8%(+0.971)#6,303 |
| 15. | 46205 | 6.6% | 4.8%(+1.83)#98 | 5.8%(+0.847)#6,541 |
| 16. | 46234 | 6.5% | 4.8%(+1.73)#103 | 5.8%(+0.745)#6,755 |
| 17. | 46239 | 6.2% | 4.8%(+1.42)#112 | 5.8%(+0.439)#7,375 |
| 18. | 46254 | 5.9% | 4.8%(+1.17)#122 | 5.8%(+0.181)#7,959 |
| 19. | 46214 | 5.7% | 4.8%(+0.972)#133 | 5.8%(-0.014)#8,429 |
| 20. | 46226 | 5.7% | 4.8%(+0.911)#139 | 5.8%(-0.074)#8,563 |
| 21. | 46203 | 5.5% | 4.8%(+0.728)#146 | 5.8%(-0.257)#9,026 |
| 22. | 46260 | 5.5% | 4.8%(+0.707)#147 | 5.8%(-0.279)#9,074 |
| 23. | 46219 | 5.4% | 4.8%(+0.665)#151 | 5.8%(-0.320)#9,182 |
| 24. | 46217 | 5.4% | 4.8%(+0.644)#153 | 5.8%(-0.341)#9,231 |
| 25. | 46229 | 5.4% | 4.8%(+0.586)#159 | 5.8%(-0.399)#9,411 |
| 26. | 46259 | 5.2% | 4.8%(+0.470)#172 | 5.8%(-0.515)#9,721 |
| 27. | 46268 | 5.1% | 4.8%(+0.340)#187 | 5.8%(-0.645)#10,137 |
| 28. | 46221 | 4.9% | 4.8%(+0.143)#197 | 5.8%(-0.842)#10,684 |
| 29. | 46218 | 4.0% | 4.8%(-0.804)#269 | 5.8%(-1.79)#13,944 |
| 30. | 46241 | 3.9% | 4.8%(-0.831)#271 | 5.8%(-1.82)#14,041 |
| 31. | 46227 | 3.8% | 4.8%(-0.938)#281 | 5.8%(-1.92)#14,447 |
| 32. | 46201 | 3.8% | 4.8%(-0.967)#287 | 5.8%(-1.95)#14,556 |
| 33. | 46235 | 3.4% | 4.8%(-1.35)#339 | 5.8%(-2.33)#16,099 |
| 34. | 46224 | 3.4% | 4.8%(-1.37)#345 | 5.8%(-2.36)#16,211 |
| 35. | 46222 | 3.2% | 4.8%(-1.53)#360 | 5.8%(-2.52)#16,864 |
| 36. | 46231 | 2.9% | 4.8%(-1.90)#408 | 5.8%(-2.89)#18,331 |
1
Common Questions
What are the Top 10 Zip Codes with the Highest Percentage of Population Employed in Business & Financial in Indianapolis, IN?
Top 10 Zip Codes with the Highest Percentage of Population Employed in Business & Financial in Indianapolis, IN are:
What zip code has the Highest Percentage of Population Employed in Business & Financial in Indianapolis, IN?
46204 has the Highest Percentage of Population Employed in Business & Financial in Indianapolis, IN with 14.4%.
What is the Percentage of Population Employed in Business & Financial in Indianapolis, IN?
Percentage of Population Employed in Business & Financial in Indianapolis is 6.2%.
What is the Percentage of Population Employed in Business & Financial in Indiana?
Percentage of Population Employed in Business & Financial in Indiana is 4.8%.
What is the Percentage of Population Employed in Business & Financial in the United States?
Percentage of Population Employed in Business & Financial in the United States is 5.8%.