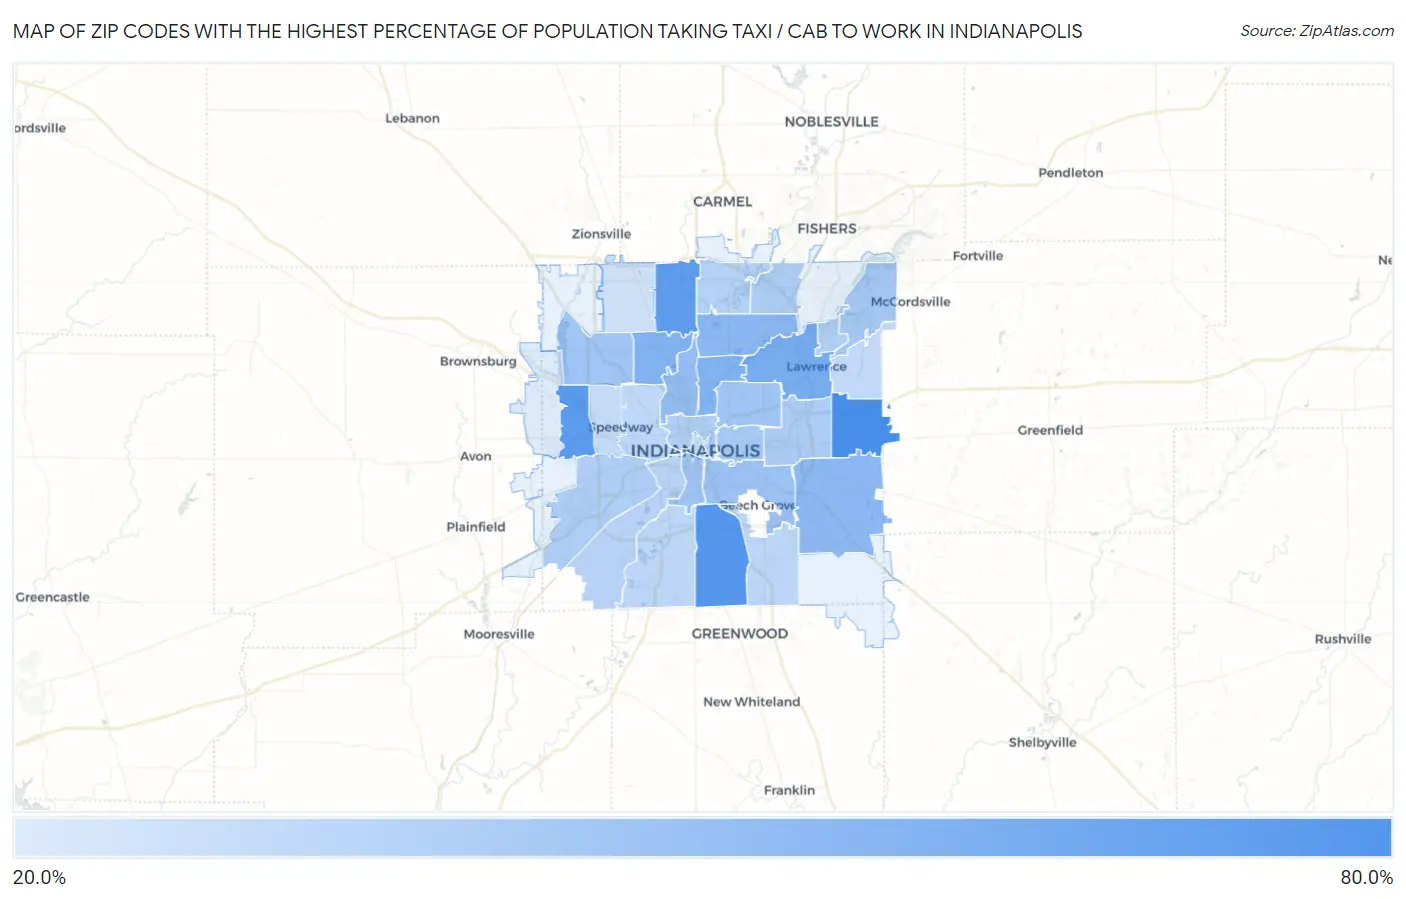
Zip Codes with the Highest Percentage of Population Taking Taxi / Cab to Work in Indianapolis, IN
RELATED REPORTS & OPTIONS
Taxi / Cab
Indianapolis
Compare Zip Codes
Map of Zip Codes with the Highest Percentage of Population Taking Taxi / Cab to Work in Indianapolis
21.0%
62.7%
Zip Codes with the Highest Percentage of Population Taking Taxi / Cab to Work in Indianapolis, IN
| Zip Code | % Take Taxi / Cab | vs State | vs National | |
| 1. | 46229 | 62.7% | 37.0%(+25.7)#11 | 38.2%(+24.5)#374 |
| 2. | 46227 | 58.1% | 37.0%(+21.1)#23 | 38.2%(+19.9)#974 |
| 3. | 46214 | 56.0% | 37.0%(+19.0)#33 | 38.2%(+17.8)#1,378 |
| 4. | 46260 | 55.2% | 37.0%(+18.2)#36 | 38.2%(+17.0)#1,541 |
| 5. | 46226 | 48.0% | 37.0%(+11.0)#84 | 38.2%(+9.80)#3,615 |
| 6. | 46205 | 45.5% | 37.0%(+8.50)#98 | 38.2%(+7.30)#4,451 |
| 7. | 46228 | 45.5% | 37.0%(+8.50)#99 | 38.2%(+7.30)#4,465 |
| 8. | 46220 | 42.3% | 37.0%(+5.30)#123 | 38.2%(+4.10)#5,604 |
| 9. | 46239 | 41.8% | 37.0%(+4.80)#125 | 38.2%(+3.60)#5,790 |
| 10. | 46208 | 40.1% | 37.0%(+3.10)#139 | 38.2%(+1.90)#6,581 |
| 11. | 46203 | 38.1% | 37.0%(+1.10)#153 | 38.2%(-0.100)#7,427 |
| 12. | 46225 | 36.5% | 37.0%(-0.500)#166 | 38.2%(-1.70)#8,218 |
| 13. | 46218 | 36.4% | 37.0%(-0.600)#167 | 38.2%(-1.80)#8,258 |
| 14. | 46254 | 36.2% | 37.0%(-0.800)#172 | 38.2%(-2.00)#8,350 |
| 15. | 46236 | 34.7% | 37.0%(-2.30)#183 | 38.2%(-3.50)#9,026 |
| 16. | 46201 | 34.6% | 37.0%(-2.40)#186 | 38.2%(-3.60)#9,078 |
| 17. | 46219 | 33.0% | 37.0%(-4.00)#202 | 38.2%(-5.20)#9,745 |
| 18. | 46250 | 32.9% | 37.0%(-4.10)#204 | 38.2%(-5.30)#9,806 |
| 19. | 46241 | 32.4% | 37.0%(-4.60)#206 | 38.2%(-5.80)#10,035 |
| 20. | 46202 | 32.0% | 37.0%(-5.00)#208 | 38.2%(-6.20)#10,161 |
| 21. | 46216 | 31.1% | 37.0%(-5.90)#215 | 38.2%(-7.10)#10,509 |
| 22. | 46240 | 30.5% | 37.0%(-6.50)#218 | 38.2%(-7.70)#10,753 |
| 23. | 46221 | 30.0% | 37.0%(-7.00)#224 | 38.2%(-8.20)#10,907 |
| 24. | 46237 | 29.0% | 37.0%(-8.00)#238 | 38.2%(-9.20)#11,243 |
| 25. | 46217 | 28.9% | 37.0%(-8.10)#239 | 38.2%(-9.30)#11,267 |
| 26. | 46222 | 28.2% | 37.0%(-8.80)#245 | 38.2%(-10.0)#11,493 |
| 27. | 46235 | 27.9% | 37.0%(-9.10)#246 | 38.2%(-10.3)#11,565 |
| 28. | 46224 | 26.9% | 37.0%(-10.1)#253 | 38.2%(-11.3)#11,825 |
| 29. | 46204 | 26.7% | 37.0%(-10.3)#254 | 38.2%(-11.5)#11,910 |
| 30. | 46268 | 24.3% | 37.0%(-12.7)#265 | 38.2%(-13.9)#12,397 |
| 31. | 46234 | 21.0% | 37.0%(-16.0)#278 | 38.2%(-17.2)#12,873 |
1
Common Questions
What are the Top 10 Zip Codes with the Highest Percentage of Population Taking Taxi / Cab to Work in Indianapolis, IN?
Top 10 Zip Codes with the Highest Percentage of Population Taking Taxi / Cab to Work in Indianapolis, IN are:
What zip code has the Highest Percentage of Population Taking Taxi / Cab to Work in Indianapolis, IN?
46229 has the Highest Percentage of Population Taking Taxi / Cab to Work in Indianapolis, IN with 62.7%.
What is the Percentage of Population Taking Taxi / Cab to Work in Indianapolis, IN?
Percentage of Population Taking Taxi / Cab to Work in Indianapolis is 33.1%.
What is the Percentage of Population Taking Taxi / Cab to Work in Indiana?
Percentage of Population Taking Taxi / Cab to Work in Indiana is 37.0%.
What is the Percentage of Population Taking Taxi / Cab to Work in the United States?
Percentage of Population Taking Taxi / Cab to Work in the United States is 38.2%.