Zip Codes with the Highest Percentage of Population with a Degree in Communications in Indianapolis, IN

RELATED REPORTS & OPTIONS

Communications
Population
Families and Households
Female Fertility
Female Fertility (Unmarried)
Race (Community Size)
Race (Percentage)
Ancestry (Community Size)
AfghanAfricanAlaskan AthabascanAlbanianAlsatianAmericanApacheArabArgentineanArmenianAustralianAustrianBahamianBangladeshiBarbadianBasqueBelgianBelizeanBhutaneseBlackfeetBolivianBrazilianBritishBritish West IndianBulgarianBurmeseCajunCanadianCelticCentral AmericanCentral American IndianCherokeeChickasawChileanChippewaChoctawColombianCosta RicanCroatianCrowCubanCzechCzechoslovakianDanishDominicanDutchEastern EuropeanEcuadorianEgyptianEnglishEstonianEthiopianEuropeanFilipinoFinnishFrenchFrench CanadianGermanGerman RussianGhanaianGreekGuamanian / ChamorroGuatemalanGuyaneseHaitianHonduranHopiHungarianIcelanderIndian (Asian)IndonesianInupiatIranianIraqiIrishIroquoisIsraeliItalianJamaicanJapaneseJordanianKenyanKoreanLaotianLatvianLebaneseLiberianLithuanianLuxembourgerMacedonianMalaysianMenomineeMexicanMexican American IndianMongolianMoroccanNative HawaiianNavajoNew ZealanderNicaraguanNigerianNorthern EuropeanNorwegianPakistaniPalestinianPanamanianPennsylvania GermanPeruvianPolishPortuguesePotawatomiPuerto RicanRomanianRussianSalvadoranSamoanScandinavianScotch-IrishScottishSeminoleSenegaleseSerbianSierra LeoneanSiouxSlavicSlovakSloveneSouth AfricanSouth AmericanSouth American IndianSpaniardSpanishSri LankanSubsaharan AfricanSudaneseSwedishSwissSyrianThaiTonganTrinidadian and TobagonianTurkishUgandanUkrainianUruguayanVenezuelanVietnameseWelshWest IndianYugoslavianZimbabwean
Ancestry (Percentage)
AfghanAfricanAlaskan AthabascanAlbanianAlsatianAmericanApacheArabArgentineanArmenianAustralianAustrianBahamianBangladeshiBarbadianBasqueBelgianBelizeanBhutaneseBlackfeetBolivianBrazilianBritishBritish West IndianBulgarianBurmeseCajunCanadianCelticCentral AmericanCentral American IndianCherokeeChickasawChileanChippewaChoctawColombianCosta RicanCroatianCrowCubanCzechCzechoslovakianDanishDominicanDutchEastern EuropeanEcuadorianEgyptianEnglishEstonianEthiopianEuropeanFilipinoFinnishFrenchFrench CanadianGermanGerman RussianGhanaianGreekGuamanian / ChamorroGuatemalanGuyaneseHaitianHonduranHopiHungarianIcelanderIndian (Asian)IndonesianInupiatIranianIraqiIrishIroquoisIsraeliItalianJamaicanJapaneseJordanianKenyanKoreanLaotianLatvianLebaneseLiberianLithuanianLuxembourgerMacedonianMalaysianMenomineeMexicanMexican American IndianMongolianMoroccanNative HawaiianNavajoNew ZealanderNicaraguanNigerianNorthern EuropeanNorwegianPakistaniPalestinianPanamanianPennsylvania GermanPeruvianPolishPortuguesePotawatomiPuerto RicanRomanianRussianSalvadoranSamoanScandinavianScotch-IrishScottishSeminoleSenegaleseSerbianSierra LeoneanSiouxSlavicSlovakSloveneSouth AfricanSouth AmericanSouth American IndianSpaniardSpanishSri LankanSubsaharan AfricanSudaneseSwedishSwissSyrianThaiTonganTrinidadian and TobagonianTurkishUgandanUkrainianUruguayanVenezuelanVietnameseWelshWest IndianYugoslavianZimbabwean
Immigrant Origin (Total)
AfghanistanAfricaArgentinaAsiaAustraliaAustriaBahamasBangladeshBarbadosBelarusBoliviaBosnia and HerzegovinaBrazilBulgariaBurma / MyanmarCambodiaCameroonCanadaCaribbeanCentral AmericaChileChinaColombiaCongoCosta RicaCubaDenmarkDominican RepublicEastern AfricaEastern AsiaEastern EuropeEcuadorEgyptEl SalvadorEnglandEritreaEthiopiaEuropeFranceGermanyGhanaGreeceGuatemalaGuyanaHaitiHondurasHong KongHungaryIndiaIndonesiaIranIraqIrelandIsraelItalyJamaicaJapanJordanKenyaKoreaLaosLatin AmericaLatviaLebanonLiberiaMalaysiaMexicoMiddle AfricaMoldovaMoroccoNepalNetherlandsNicaraguaNigeriaNorth MacedoniaNorthern AfricaNorthern EuropeNorwayOceaniaPakistanPanamaPeruPhilippinesPolandPortugalRomaniaRussiaSaudi ArabiaScotlandSenegalSerbiaSierra LeoneSingaporeSouth AfricaSouth AmericaSouth Central AsiaSouth Eastern AsiaSouthern EuropeSpainSt. Vincent and the GrenadinesSudanSyriaTaiwanThailandTrinidad and TobagoTurkeyUgandaUkraineUzbekistanVenezuelaVietnamWest IndiesWestern AfricaWestern AsiaWestern EuropeYemenZaireZimbabwe
Immigrant Origin (Percentage)
AfghanistanAfricaArgentinaAsiaAustraliaAustriaBahamasBangladeshBarbadosBelarusBoliviaBosnia and HerzegovinaBrazilBulgariaBurma / MyanmarCambodiaCameroonCanadaCaribbeanCentral AmericaChileChinaColombiaCongoCosta RicaCubaDenmarkDominican RepublicEastern AfricaEastern AsiaEastern EuropeEcuadorEgyptEl SalvadorEnglandEritreaEthiopiaEuropeFranceGermanyGhanaGreeceGuatemalaGuyanaHaitiHondurasHong KongHungaryIndiaIndonesiaIranIraqIrelandIsraelItalyJamaicaJapanJordanKenyaKoreaLaosLatin AmericaLatviaLebanonLiberiaMalaysiaMexicoMiddle AfricaMoldovaMoroccoNepalNetherlandsNicaraguaNigeriaNorth MacedoniaNorthern AfricaNorthern EuropeNorwayOceaniaPakistanPanamaPeruPhilippinesPolandPortugalRomaniaRussiaSaudi ArabiaScotlandSenegalSerbiaSierra LeoneSingaporeSouth AfricaSouth AmericaSouth Central AsiaSouth Eastern AsiaSouthern EuropeSpainSt. Vincent and the GrenadinesSudanSyriaTaiwanThailandTrinidad and TobagoTurkeyUgandaUkraineUzbekistanVenezuelaVietnamWest IndiesWestern AfricaWestern AsiaWestern EuropeYemenZaireZimbabwe
Income
Income (Families)
Income (Households)
Poverty
Poverty (Families)
Unemployment
Employment Occupations
Employment Industries
Employer Class
Commute Time
Commute Means
School Enrollment
Education by Degree Field
Occupancy
Finances
Physical Characteristics
Indianapolis
Compare Zip Codes
Comparison Subject

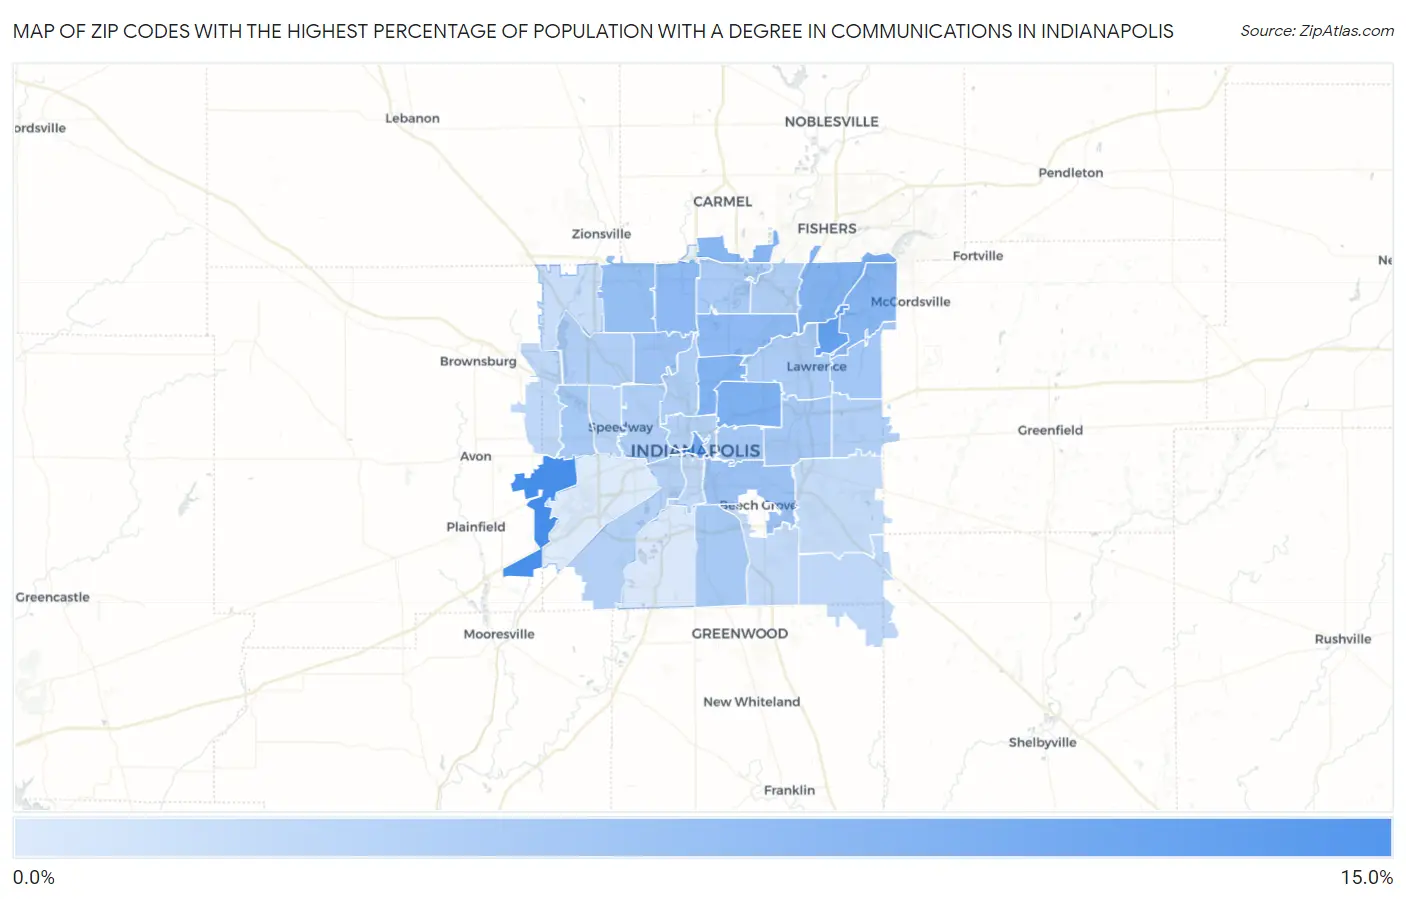
Map of Zip Codes with the Highest Percentage of Population with a Degree in Communications in Indianapolis

0.0%
15.0%
Zip Codes with the Highest Percentage of Population with a Degree in Communications in Indianapolis Map

Zip Codes with the Highest Percentage of Population with a Degree in Communications in Indianapolis, IN

Zip Code % Graduates vs State vs National
1.4623111.2%3.7%(+7.58)#214.1%(+7.10)#939
2.462169.1%3.7%(+5.45)#334.1%(+4.97)#1,395
3.462048.1%3.7%(+4.46)#394.1%(+3.98)#1,809
4.462187.4%3.7%(+3.71)#474.1%(+3.22)#2,299
5.462057.2%3.7%(+3.55)#504.1%(+3.07)#2,432
6.462567.0%3.7%(+3.32)#554.1%(+2.84)#2,632
7.462806.8%3.7%(+3.12)#634.1%(+2.64)#2,822
8.462366.7%3.7%(+3.02)#644.1%(+2.53)#2,937
9.462206.3%3.7%(+2.61)#794.1%(+2.13)#3,405
10.462606.2%3.7%(+2.57)#824.1%(+2.08)#3,465
11.462685.8%3.7%(+2.10)#954.1%(+1.62)#4,179
12.462035.4%3.7%(+1.72)#1114.1%(+1.24)#4,903
13.462285.3%3.7%(+1.64)#1144.1%(+1.15)#5,067
14.462354.9%3.7%(+1.24)#1284.1%(+0.754)#5,947
15.462014.7%3.7%(+1.05)#1344.1%(+0.566)#6,404
16.462194.7%3.7%(+1.01)#1374.1%(+0.528)#6,515
17.462144.5%3.7%(+0.856)#1434.1%(+0.373)#6,936
18.462274.5%3.7%(+0.808)#1484.1%(+0.325)#7,067
19.462404.4%3.7%(+0.783)#1524.1%(+0.299)#7,147
20.462264.3%3.7%(+0.626)#1634.1%(+0.142)#7,647
21.462224.1%3.7%(+0.440)#1764.1%(-0.043)#8,259
22.462504.1%3.7%(+0.419)#1784.1%(-0.065)#8,347
23.462543.9%3.7%(+0.234)#1904.1%(-0.250)#8,960
24.462083.9%3.7%(+0.201)#1944.1%(-0.282)#9,082
25.462293.8%3.7%(+0.179)#1964.1%(-0.305)#9,166
26.462023.8%3.7%(+0.137)#2004.1%(-0.347)#9,325
27.462213.8%3.7%(+0.123)#2024.1%(-0.361)#9,376
28.462243.2%3.7%(-0.413)#2404.1%(-0.897)#11,299
29.462343.0%3.7%(-0.660)#2644.1%(-1.14)#12,220
30.462593.0%3.7%(-0.672)#2654.1%(-1.16)#12,273
31.462372.9%3.7%(-0.749)#2704.1%(-1.23)#12,591
32.462252.9%3.7%(-0.761)#2724.1%(-1.24)#12,646
33.462392.7%3.7%(-0.922)#2924.1%(-1.41)#13,282
34.462782.3%3.7%(-1.35)#3204.1%(-1.83)#14,821
35.462171.2%3.7%(-2.49)#4164.1%(-2.98)#18,542
36.462411.0%3.7%(-2.63)#4224.1%(-3.11)#18,912

Common Questions

What are the Top 10 Zip Codes with the Highest Percentage of Population with a Degree in Communications in Indianapolis, IN?
Top 10 Zip Codes with the Highest Percentage of Population with a Degree in Communications in Indianapolis, IN are:
#1
11.2%
#2
9.1%
#3
8.1%
#4
7.4%
#5
7.2%
#6
7.0%
#7
6.8%
#8
6.7%
#9
6.3%
#10
6.2%
What zip code has the Highest Percentage of Population with a Degree in Communications in Indianapolis, IN?
46231 has the Highest Percentage of Population with a Degree in Communications in Indianapolis, IN with 11.2%.
What is the Percentage of Population with a Degree in Communications in Indianapolis, IN?
Percentage of Population with a Degree in Communications in Indianapolis is 4.7%.
What is the Percentage of Population with a Degree in Communications in Indiana?
Percentage of Population with a Degree in Communications in Indiana is 3.7%.
What is the Percentage of Population with a Degree in Communications in the United States?
Percentage of Population with a Degree in Communications in the United States is 4.1%.