Zip Codes with the Highest Percentage of Not-for-profit Organizations in Indianapolis, IN

RELATED REPORTS & OPTIONS

Not-for-profit Organizations
Population
Families and Households
Female Fertility
Female Fertility (Unmarried)
Race (Community Size)
Race (Percentage)
Ancestry (Community Size)
AfghanAfricanAlaskan AthabascanAlbanianAlsatianAmericanApacheArabArgentineanArmenianAustralianAustrianBahamianBangladeshiBarbadianBasqueBelgianBelizeanBhutaneseBlackfeetBolivianBrazilianBritishBritish West IndianBulgarianBurmeseCajunCanadianCelticCentral AmericanCentral American IndianCherokeeChickasawChileanChippewaChoctawColombianCosta RicanCroatianCrowCubanCzechCzechoslovakianDanishDominicanDutchEastern EuropeanEcuadorianEgyptianEnglishEstonianEthiopianEuropeanFilipinoFinnishFrenchFrench CanadianGermanGerman RussianGhanaianGreekGuamanian / ChamorroGuatemalanGuyaneseHaitianHonduranHopiHungarianIcelanderIndian (Asian)IndonesianInupiatIranianIraqiIrishIroquoisIsraeliItalianJamaicanJapaneseJordanianKenyanKoreanLaotianLatvianLebaneseLiberianLithuanianLuxembourgerMacedonianMalaysianMenomineeMexicanMexican American IndianMongolianMoroccanNative HawaiianNavajoNew ZealanderNicaraguanNigerianNorthern EuropeanNorwegianPakistaniPalestinianPanamanianPennsylvania GermanPeruvianPolishPortuguesePotawatomiPuerto RicanRomanianRussianSalvadoranSamoanScandinavianScotch-IrishScottishSeminoleSenegaleseSerbianSierra LeoneanSiouxSlavicSlovakSloveneSouth AfricanSouth AmericanSouth American IndianSpaniardSpanishSri LankanSubsaharan AfricanSudaneseSwedishSwissSyrianThaiTonganTrinidadian and TobagonianTurkishUgandanUkrainianUruguayanVenezuelanVietnameseWelshWest IndianYugoslavianZimbabwean
Ancestry (Percentage)
AfghanAfricanAlaskan AthabascanAlbanianAlsatianAmericanApacheArabArgentineanArmenianAustralianAustrianBahamianBangladeshiBarbadianBasqueBelgianBelizeanBhutaneseBlackfeetBolivianBrazilianBritishBritish West IndianBulgarianBurmeseCajunCanadianCelticCentral AmericanCentral American IndianCherokeeChickasawChileanChippewaChoctawColombianCosta RicanCroatianCrowCubanCzechCzechoslovakianDanishDominicanDutchEastern EuropeanEcuadorianEgyptianEnglishEstonianEthiopianEuropeanFilipinoFinnishFrenchFrench CanadianGermanGerman RussianGhanaianGreekGuamanian / ChamorroGuatemalanGuyaneseHaitianHonduranHopiHungarianIcelanderIndian (Asian)IndonesianInupiatIranianIraqiIrishIroquoisIsraeliItalianJamaicanJapaneseJordanianKenyanKoreanLaotianLatvianLebaneseLiberianLithuanianLuxembourgerMacedonianMalaysianMenomineeMexicanMexican American IndianMongolianMoroccanNative HawaiianNavajoNew ZealanderNicaraguanNigerianNorthern EuropeanNorwegianPakistaniPalestinianPanamanianPennsylvania GermanPeruvianPolishPortuguesePotawatomiPuerto RicanRomanianRussianSalvadoranSamoanScandinavianScotch-IrishScottishSeminoleSenegaleseSerbianSierra LeoneanSiouxSlavicSlovakSloveneSouth AfricanSouth AmericanSouth American IndianSpaniardSpanishSri LankanSubsaharan AfricanSudaneseSwedishSwissSyrianThaiTonganTrinidadian and TobagonianTurkishUgandanUkrainianUruguayanVenezuelanVietnameseWelshWest IndianYugoslavianZimbabwean
Immigrant Origin (Total)
AfghanistanAfricaArgentinaAsiaAustraliaAustriaBahamasBangladeshBarbadosBelarusBoliviaBosnia and HerzegovinaBrazilBulgariaBurma / MyanmarCambodiaCameroonCanadaCaribbeanCentral AmericaChileChinaColombiaCongoCosta RicaCubaDenmarkDominican RepublicEastern AfricaEastern AsiaEastern EuropeEcuadorEgyptEl SalvadorEnglandEritreaEthiopiaEuropeFranceGermanyGhanaGreeceGuatemalaGuyanaHaitiHondurasHong KongHungaryIndiaIndonesiaIranIraqIrelandIsraelItalyJamaicaJapanJordanKenyaKoreaLaosLatin AmericaLatviaLebanonLiberiaMalaysiaMexicoMiddle AfricaMoldovaMoroccoNepalNetherlandsNicaraguaNigeriaNorth MacedoniaNorthern AfricaNorthern EuropeNorwayOceaniaPakistanPanamaPeruPhilippinesPolandPortugalRomaniaRussiaSaudi ArabiaScotlandSenegalSerbiaSierra LeoneSingaporeSouth AfricaSouth AmericaSouth Central AsiaSouth Eastern AsiaSouthern EuropeSpainSt. Vincent and the GrenadinesSudanSyriaTaiwanThailandTrinidad and TobagoTurkeyUgandaUkraineUzbekistanVenezuelaVietnamWest IndiesWestern AfricaWestern AsiaWestern EuropeYemenZaireZimbabwe
Immigrant Origin (Percentage)
AfghanistanAfricaArgentinaAsiaAustraliaAustriaBahamasBangladeshBarbadosBelarusBoliviaBosnia and HerzegovinaBrazilBulgariaBurma / MyanmarCambodiaCameroonCanadaCaribbeanCentral AmericaChileChinaColombiaCongoCosta RicaCubaDenmarkDominican RepublicEastern AfricaEastern AsiaEastern EuropeEcuadorEgyptEl SalvadorEnglandEritreaEthiopiaEuropeFranceGermanyGhanaGreeceGuatemalaGuyanaHaitiHondurasHong KongHungaryIndiaIndonesiaIranIraqIrelandIsraelItalyJamaicaJapanJordanKenyaKoreaLaosLatin AmericaLatviaLebanonLiberiaMalaysiaMexicoMiddle AfricaMoldovaMoroccoNepalNetherlandsNicaraguaNigeriaNorth MacedoniaNorthern AfricaNorthern EuropeNorwayOceaniaPakistanPanamaPeruPhilippinesPolandPortugalRomaniaRussiaSaudi ArabiaScotlandSenegalSerbiaSierra LeoneSingaporeSouth AfricaSouth AmericaSouth Central AsiaSouth Eastern AsiaSouthern EuropeSpainSt. Vincent and the GrenadinesSudanSyriaTaiwanThailandTrinidad and TobagoTurkeyUgandaUkraineUzbekistanVenezuelaVietnamWest IndiesWestern AfricaWestern AsiaWestern EuropeYemenZaireZimbabwe
Income
Income (Families)
Income (Households)
Poverty
Poverty (Families)
Unemployment
Employment Occupations
Employment Industries
Employer Class
Commute Time
Commute Means
School Enrollment
Education by Degree Field
Occupancy
Finances
Physical Characteristics
Indianapolis
Compare Zip Codes
Comparison Subject

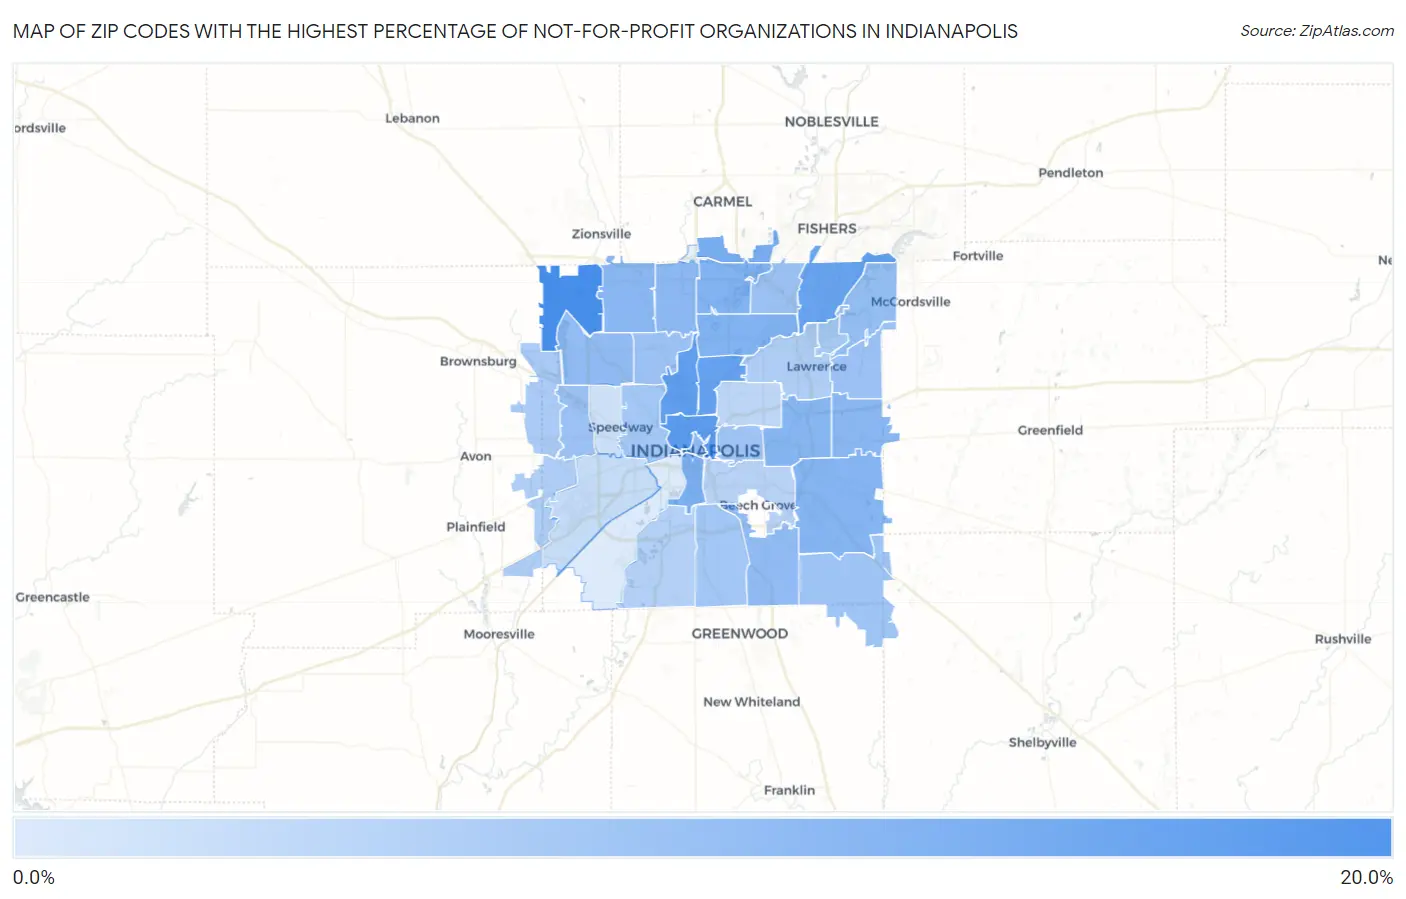
Map of Zip Codes with the Highest Percentage of Not-for-profit Organizations in Indianapolis

0.0%
20.0%
Zip Codes with the Highest Percentage of Not-for-profit Organizations in Indianapolis Map

Zip Codes with the Highest Percentage of Not-for-profit Organizations in Indianapolis, IN

Zip Code % Employed in Not-for-profit vs State vs National
1.4627816.8%9.8%(+7.00)#398.4%(+8.34)#2,108
2.4620215.4%9.8%(+5.63)#618.4%(+6.97)#2,719
3.4620814.8%9.8%(+4.98)#698.4%(+6.31)#3,085
4.4620514.5%9.8%(+4.74)#728.4%(+6.08)#3,218
5.4625614.1%9.8%(+4.30)#838.4%(+5.63)#3,523
6.4628013.1%9.8%(+3.30)#1068.4%(+4.64)#4,433
7.4622512.7%9.8%(+2.96)#1198.4%(+4.30)#4,779
8.4624012.4%9.8%(+2.63)#1288.4%(+3.96)#5,152
9.4622012.3%9.8%(+2.52)#1318.4%(+3.85)#5,266
10.4623912.0%9.8%(+2.26)#1428.4%(+3.60)#5,586
11.4621911.8%9.8%(+1.98)#1508.4%(+3.31)#5,962
12.4626811.7%9.8%(+1.90)#1548.4%(+3.24)#6,074
13.4622911.6%9.8%(+1.81)#1598.4%(+3.15)#6,195
14.4626011.4%9.8%(+1.62)#1698.4%(+2.95)#6,457
15.4625411.2%9.8%(+1.42)#1798.4%(+2.75)#6,751
16.4623711.1%9.8%(+1.30)#1858.4%(+2.64)#6,937
17.4620411.0%9.8%(+1.25)#1918.4%(+2.58)#7,018
18.4623610.7%9.8%(+0.935)#2128.4%(+2.27)#7,525
19.4622810.4%9.8%(+0.668)#2248.4%(+2.00)#8,016
20.4621410.4%9.8%(+0.610)#2308.4%(+1.95)#8,132
21.4623510.3%9.8%(+0.539)#2358.4%(+1.87)#8,261
22.4625010.2%9.8%(+0.404)#2468.4%(+1.74)#8,542
23.4625910.1%9.8%(+0.345)#2538.4%(+1.68)#8,662
24.4620110.0%9.8%(+0.177)#2678.4%(+1.51)#8,992
25.462229.7%9.8%(-0.103)#2868.4%(+1.23)#9,575
26.462279.7%9.8%(-0.110)#2878.4%(+1.23)#9,586
27.462169.4%9.8%(-0.372)#3038.4%(+0.964)#10,148
28.462349.2%9.8%(-0.587)#3148.4%(+0.749)#10,609
29.462318.9%9.8%(-0.859)#3358.4%(+0.477)#11,250
30.462268.9%9.8%(-0.891)#3368.4%(+0.444)#11,338
31.462178.6%9.8%(-1.14)#3578.4%(+0.195)#11,938
32.462038.2%9.8%(-1.61)#3968.4%(-0.271)#13,172
33.462187.9%9.8%(-1.88)#4188.4%(-0.540)#13,880
34.462417.3%9.8%(-2.51)#4668.4%(-1.17)#15,796
35.462246.5%9.8%(-3.31)#5228.4%(-1.97)#18,105
36.462215.6%9.8%(-4.22)#5758.4%(-2.88)#20,757

Common Questions

What are the Top 10 Zip Codes with the Highest Percentage of Not-for-profit Organizations in Indianapolis, IN?
Top 10 Zip Codes with the Highest Percentage of Not-for-profit Organizations in Indianapolis, IN are:
#1
16.8%
#2
15.4%
#3
14.8%
#4
14.5%
#5
14.1%
#6
13.1%
#7
12.7%
#8
12.4%
#9
12.3%
#10
12.0%
What zip code has the Highest Percentage of Not-for-profit Organizations in Indianapolis, IN?
46278 has the Highest Percentage of Not-for-profit Organizations in Indianapolis, IN with 16.8%.
What is the Percentage of Not-for-profit Organizations in Indianapolis, IN?
Percentage of Not-for-profit Organizations in Indianapolis is 10.7%.
What is the Percentage of Not-for-profit Organizations in Indiana?
Percentage of Not-for-profit Organizations in Indiana is 9.8%.
What is the Percentage of Not-for-profit Organizations in the United States?
Percentage of Not-for-profit Organizations in the United States is 8.4%.