Zip Codes with the Highest Percentage of Population Employed in Construction & Extraction in Indianapolis, IN
RELATED REPORTS & OPTIONS
Construction & Extraction
Indianapolis
Compare Zip Codes
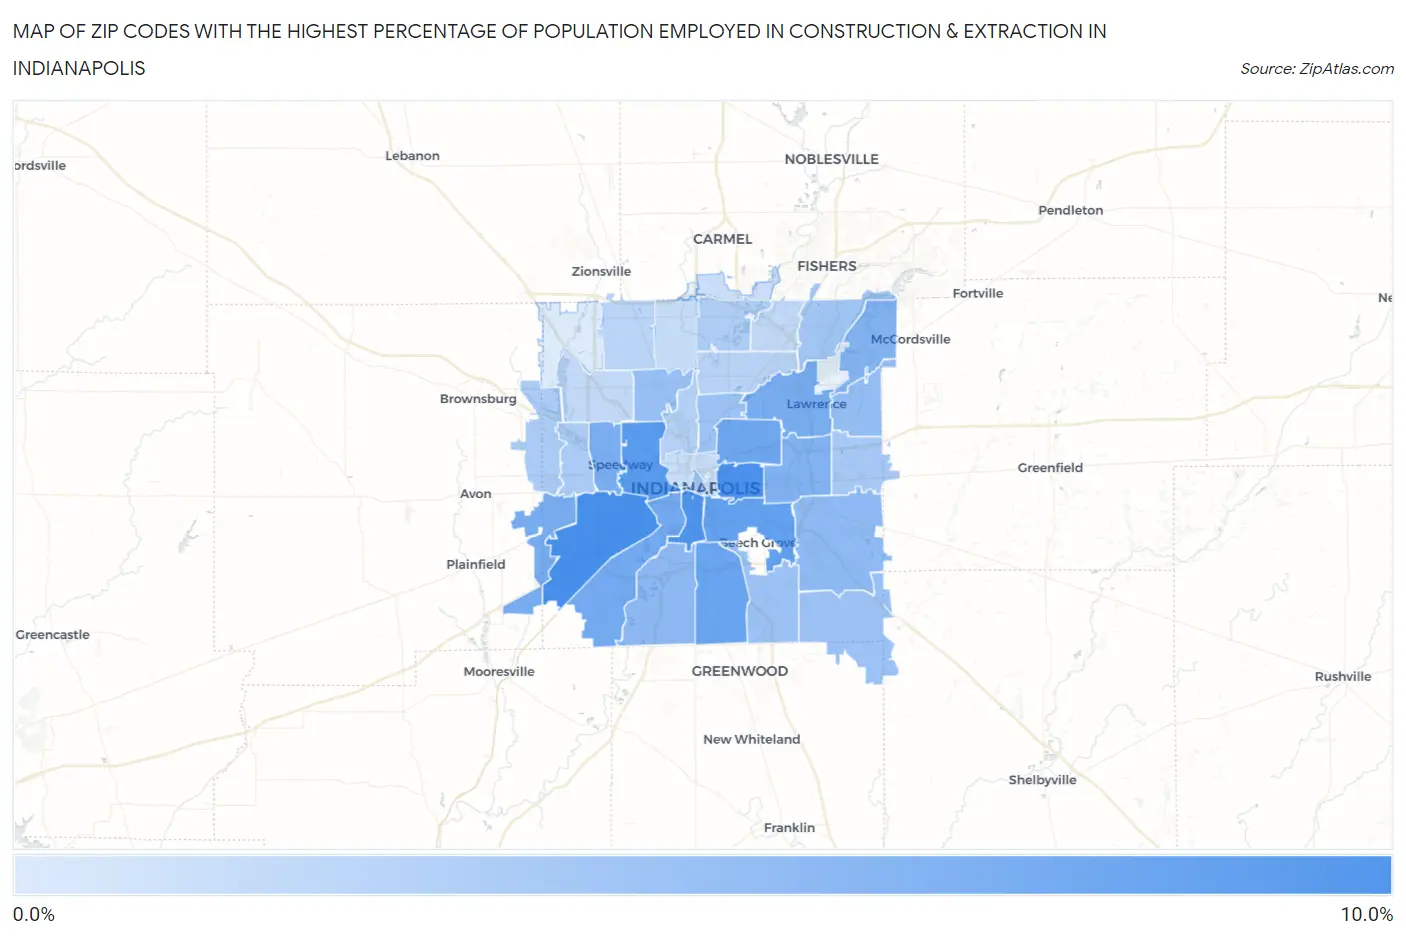
Map of Zip Codes with the Highest Percentage of Population Employed in Construction & Extraction in Indianapolis
0.11%
8.5%
Zip Codes with the Highest Percentage of Population Employed in Construction & Extraction in Indianapolis, IN
| Zip Code | % Employed | vs State | vs National | |
| 1. | 46241 | 8.5% | 4.7%(+3.79)#150 | 5.0%(+3.50)#7,592 |
| 2. | 46201 | 8.3% | 4.7%(+3.62)#157 | 5.0%(+3.33)#7,888 |
| 3. | 46225 | 8.1% | 4.7%(+3.38)#171 | 5.0%(+3.09)#8,308 |
| 4. | 46222 | 7.6% | 4.7%(+2.85)#194 | 5.0%(+2.56)#9,419 |
| 5. | 46203 | 6.9% | 4.7%(+2.19)#237 | 5.0%(+1.91)#10,979 |
| 6. | 46227 | 6.5% | 4.7%(+1.79)#269 | 5.0%(+1.50)#12,034 |
| 7. | 46218 | 6.2% | 4.7%(+1.49)#295 | 5.0%(+1.20)#12,904 |
| 8. | 46221 | 6.0% | 4.7%(+1.33)#305 | 5.0%(+1.04)#13,393 |
| 9. | 46226 | 5.7% | 4.7%(+1.00)#335 | 5.0%(+0.714)#14,357 |
| 10. | 46231 | 5.7% | 4.7%(+0.955)#339 | 5.0%(+0.666)#14,504 |
| 11. | 46224 | 5.6% | 4.7%(+0.890)#346 | 5.0%(+0.602)#14,723 |
| 12. | 46219 | 5.2% | 4.7%(+0.466)#376 | 5.0%(+0.178)#16,150 |
| 13. | 46236 | 5.1% | 4.7%(+0.379)#385 | 5.0%(+0.090)#16,439 |
| 14. | 46217 | 4.5% | 4.7%(-0.178)#438 | 5.0%(-0.466)#18,400 |
| 15. | 46239 | 4.4% | 4.7%(-0.311)#453 | 5.0%(-0.600)#18,893 |
| 16. | 46235 | 4.1% | 4.7%(-0.579)#479 | 5.0%(-0.867)#19,852 |
| 17. | 46228 | 4.0% | 4.7%(-0.748)#507 | 5.0%(-1.04)#20,505 |
| 18. | 46237 | 3.7% | 4.7%(-1.04)#530 | 5.0%(-1.33)#21,459 |
| 19. | 46259 | 3.6% | 4.7%(-1.06)#532 | 5.0%(-1.35)#21,547 |
| 20. | 46204 | 3.6% | 4.7%(-1.10)#537 | 5.0%(-1.39)#21,672 |
| 21. | 46205 | 3.6% | 4.7%(-1.12)#538 | 5.0%(-1.41)#21,732 |
| 22. | 46256 | 3.2% | 4.7%(-1.50)#574 | 5.0%(-1.79)#22,941 |
| 23. | 46229 | 3.1% | 4.7%(-1.60)#584 | 5.0%(-1.89)#23,275 |
| 24. | 46234 | 2.9% | 4.7%(-1.84)#596 | 5.0%(-2.13)#23,992 |
| 25. | 46214 | 2.8% | 4.7%(-1.88)#600 | 5.0%(-2.17)#24,092 |
| 26. | 46240 | 2.7% | 4.7%(-2.03)#614 | 5.0%(-2.32)#24,564 |
| 27. | 46208 | 2.4% | 4.7%(-2.35)#631 | 5.0%(-2.64)#25,431 |
| 28. | 46220 | 2.1% | 4.7%(-2.56)#641 | 5.0%(-2.85)#25,964 |
| 29. | 46268 | 2.0% | 4.7%(-2.68)#648 | 5.0%(-2.97)#26,265 |
| 30. | 46254 | 1.6% | 4.7%(-3.12)#670 | 5.0%(-3.41)#27,241 |
| 31. | 46250 | 1.5% | 4.7%(-3.16)#673 | 5.0%(-3.44)#27,322 |
| 32. | 46260 | 1.4% | 4.7%(-3.32)#681 | 5.0%(-3.61)#27,660 |
| 33. | 46202 | 1.2% | 4.7%(-3.49)#684 | 5.0%(-3.78)#27,978 |
| 34. | 46280 | 1.1% | 4.7%(-3.64)#688 | 5.0%(-3.93)#28,222 |
| 35. | 46278 | 0.11% | 4.7%(-4.59)#706 | 5.0%(-4.88)#29,141 |
1
Common Questions
What are the Top 10 Zip Codes with the Highest Percentage of Population Employed in Construction & Extraction in Indianapolis, IN?
Top 10 Zip Codes with the Highest Percentage of Population Employed in Construction & Extraction in Indianapolis, IN are:
What zip code has the Highest Percentage of Population Employed in Construction & Extraction in Indianapolis, IN?
46241 has the Highest Percentage of Population Employed in Construction & Extraction in Indianapolis, IN with 8.5%.
What is the Percentage of Population Employed in Construction & Extraction in Indianapolis, IN?
Percentage of Population Employed in Construction & Extraction in Indianapolis is 4.2%.
What is the Percentage of Population Employed in Construction & Extraction in Indiana?
Percentage of Population Employed in Construction & Extraction in Indiana is 4.7%.
What is the Percentage of Population Employed in Construction & Extraction in the United States?
Percentage of Population Employed in Construction & Extraction in the United States is 5.0%.