Zip Codes with the Highest Percentage of Households Residing in Detached Homes in Indianapolis, IN
RELATED REPORTS & OPTIONS
Detached Home Residency
Indianapolis
Compare Zip Codes
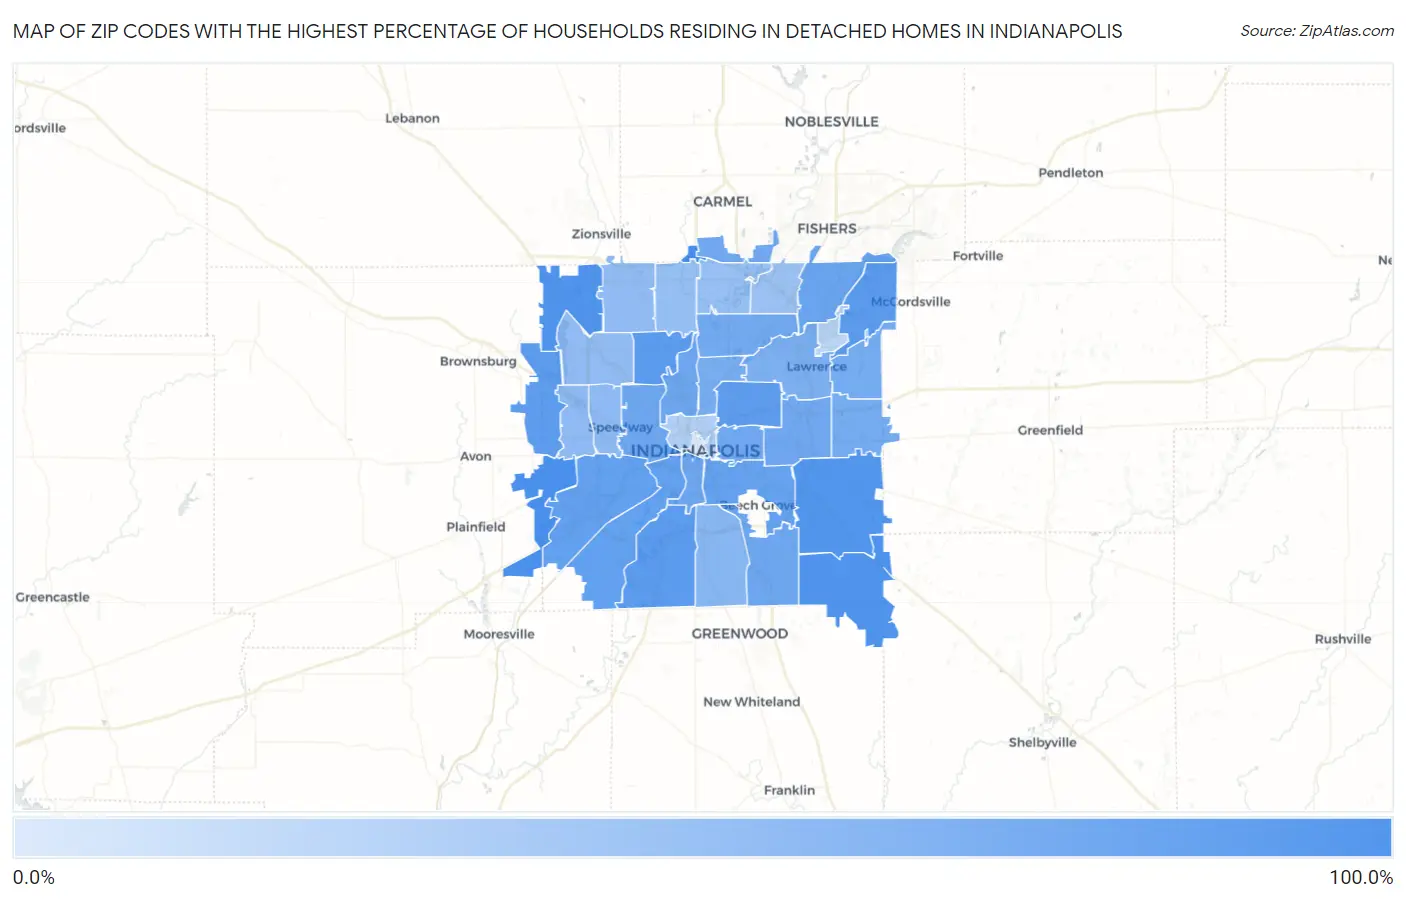
Map of Zip Codes with the Highest Percentage of Households Residing in Detached Homes in Indianapolis
2.2%
100.0%
Zip Codes with the Highest Percentage of Households Residing in Detached Homes in Indianapolis, IN
| Zip Code | Detached Home Residency | vs State | vs National | |
| 1. | 46290 | 100.0% | 74.4%(+25.6)#38 | 62.5%(+37.5)#1,194 |
| 2. | 46231 | 98.8% | 74.4%(+24.4)#61 | 62.5%(+36.3)#2,067 |
| 3. | 46259 | 94.4% | 74.4%(+20.0)#118 | 62.5%(+31.9)#3,941 |
| 4. | 46278 | 91.1% | 74.4%(+16.7)#198 | 62.5%(+28.6)#5,866 |
| 5. | 46239 | 90.4% | 74.4%(+16.0)#221 | 62.5%(+27.9)#6,297 |
| 6. | 46236 | 85.0% | 74.4%(+10.6)#368 | 62.5%(+22.5)#10,174 |
| 7. | 46228 | 84.5% | 74.4%(+10.1)#382 | 62.5%(+22.0)#10,597 |
| 8. | 46217 | 82.9% | 74.4%(+8.50)#433 | 62.5%(+20.4)#11,860 |
| 9. | 46234 | 80.1% | 74.4%(+5.70)#502 | 62.5%(+17.6)#14,105 |
| 10. | 46218 | 80.0% | 74.4%(+5.60)#505 | 62.5%(+17.5)#14,177 |
| 11. | 46221 | 76.7% | 74.4%(+2.30)#569 | 62.5%(+14.2)#16,800 |
| 12. | 46241 | 75.9% | 74.4%(+1.50)#580 | 62.5%(+13.4)#17,446 |
| 13. | 46203 | 74.8% | 74.4%(+0.400)#605 | 62.5%(+12.3)#18,300 |
| 14. | 46256 | 70.1% | 74.4%(-4.30)#670 | 62.5%(+7.60)#21,587 |
| 15. | 46208 | 68.3% | 74.4%(-6.10)#683 | 62.5%(+5.80)#22,659 |
| 16. | 46222 | 68.0% | 74.4%(-6.40)#684 | 62.5%(+5.50)#22,831 |
| 17. | 46225 | 67.4% | 74.4%(-7.00)#692 | 62.5%(+4.90)#23,177 |
| 18. | 46237 | 67.1% | 74.4%(-7.30)#693 | 62.5%(+4.60)#23,329 |
| 19. | 46201 | 66.2% | 74.4%(-8.20)#703 | 62.5%(+3.70)#23,828 |
| 20. | 46280 | 66.1% | 74.4%(-8.30)#704 | 62.5%(+3.60)#23,894 |
| 21. | 46219 | 65.9% | 74.4%(-8.50)#705 | 62.5%(+3.40)#23,981 |
| 22. | 46220 | 64.5% | 74.4%(-9.90)#712 | 62.5%(+2.00)#24,677 |
| 23. | 46235 | 63.1% | 74.4%(-11.3)#715 | 62.5%(+0.600)#25,289 |
| 24. | 46229 | 62.8% | 74.4%(-11.6)#720 | 62.5%(+0.300)#25,413 |
| 25. | 46205 | 60.4% | 74.4%(-14.0)#733 | 62.5%(-2.10)#26,307 |
| 26. | 46226 | 58.5% | 74.4%(-15.9)#740 | 62.5%(-4.00)#26,990 |
| 27. | 46227 | 49.7% | 74.4%(-24.7)#757 | 62.5%(-12.8)#29,213 |
| 28. | 46224 | 45.1% | 74.4%(-29.3)#762 | 62.5%(-17.4)#29,923 |
| 29. | 46214 | 44.5% | 74.4%(-29.9)#764 | 62.5%(-18.0)#30,018 |
| 30. | 46254 | 44.4% | 74.4%(-30.0)#765 | 62.5%(-18.1)#30,028 |
| 31. | 46268 | 43.4% | 74.4%(-31.0)#766 | 62.5%(-19.1)#30,149 |
| 32. | 46260 | 40.4% | 74.4%(-34.0)#768 | 62.5%(-22.1)#30,490 |
| 33. | 46240 | 39.6% | 74.4%(-34.8)#770 | 62.5%(-22.9)#30,593 |
| 34. | 46250 | 37.3% | 74.4%(-37.1)#771 | 62.5%(-25.2)#30,798 |
| 35. | 46202 | 24.6% | 74.4%(-49.8)#775 | 62.5%(-37.9)#31,572 |
| 36. | 46216 | 18.7% | 74.4%(-55.7)#776 | 62.5%(-43.8)#31,813 |
| 37. | 46204 | 2.2% | 74.4%(-72.2)#780 | 62.5%(-60.3)#32,443 |
1
Common Questions
What are the Top 10 Zip Codes with the Highest Percentage of Households Residing in Detached Homes in Indianapolis, IN?
Top 10 Zip Codes with the Highest Percentage of Households Residing in Detached Homes in Indianapolis, IN are:
What zip code has the Highest Percentage of Households Residing in Detached Homes in Indianapolis, IN?
46290 has the Highest Percentage of Households Residing in Detached Homes in Indianapolis, IN with 100.0%.
What is the Percentage of Households Residing in Detached Homes in Indianapolis, IN?
Percentage of Households Residing in Detached Homes in Indianapolis is 61.4%.
What is the Percentage of Households Residing in Detached Homes in Indiana?
Percentage of Households Residing in Detached Homes in Indiana is 74.4%.
What is the Percentage of Households Residing in Detached Homes in the United States?
Percentage of Households Residing in Detached Homes in the United States is 62.5%.