Zip Codes with the Highest Percentage of Population Employed in Education, Arts & Media in Indianapolis, IN
RELATED REPORTS & OPTIONS
Education, Arts & Media
Indianapolis
Compare Zip Codes
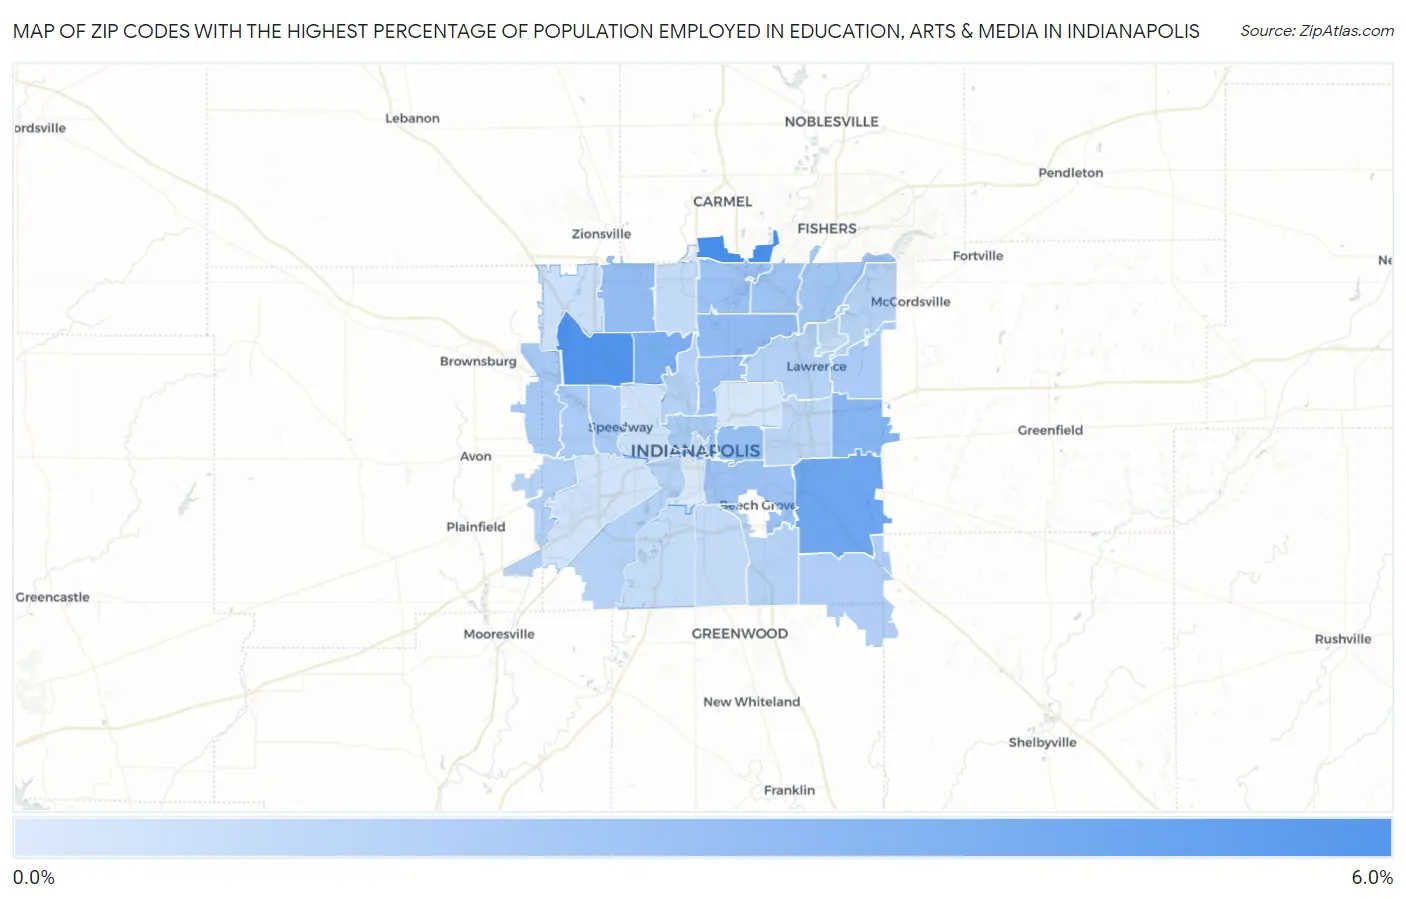
Map of Zip Codes with the Highest Percentage of Population Employed in Education, Arts & Media in Indianapolis
0.30%
5.1%
Zip Codes with the Highest Percentage of Population Employed in Education, Arts & Media in Indianapolis, IN
| Zip Code | % Employed | vs State | vs National | |
| 1. | 46280 | 5.1% | 1.8%(+3.35)#23 | 1.8%(+3.36)#1,429 |
| 2. | 46254 | 4.9% | 1.8%(+3.07)#29 | 1.8%(+3.08)#1,600 |
| 3. | 46239 | 3.9% | 1.8%(+2.06)#52 | 1.8%(+2.07)#2,653 |
| 4. | 46228 | 3.5% | 1.8%(+1.69)#61 | 1.8%(+1.70)#3,312 |
| 5. | 46229 | 3.1% | 1.8%(+1.34)#78 | 1.8%(+1.34)#4,127 |
| 6. | 46220 | 2.7% | 1.8%(+0.906)#116 | 1.8%(+0.912)#5,606 |
| 7. | 46268 | 2.6% | 1.8%(+0.834)#128 | 1.8%(+0.840)#5,927 |
| 8. | 46201 | 2.6% | 1.8%(+0.778)#134 | 1.8%(+0.785)#6,160 |
| 9. | 46205 | 2.4% | 1.8%(+0.647)#151 | 1.8%(+0.653)#6,829 |
| 10. | 46240 | 2.3% | 1.8%(+0.546)#162 | 1.8%(+0.552)#7,379 |
| 11. | 46203 | 2.3% | 1.8%(+0.542)#163 | 1.8%(+0.548)#7,401 |
| 12. | 46250 | 2.3% | 1.8%(+0.509)#168 | 1.8%(+0.515)#7,603 |
| 13. | 46256 | 2.2% | 1.8%(+0.362)#189 | 1.8%(+0.368)#8,489 |
| 14. | 46234 | 2.0% | 1.8%(+0.171)#213 | 1.8%(+0.178)#9,836 |
| 15. | 46202 | 2.0% | 1.8%(+0.166)#218 | 1.8%(+0.173)#9,876 |
| 16. | 46224 | 2.0% | 1.8%(+0.158)#219 | 1.8%(+0.164)#9,945 |
| 17. | 46235 | 1.9% | 1.8%(+0.128)#227 | 1.8%(+0.134)#10,173 |
| 18. | 46214 | 1.9% | 1.8%(+0.121)#230 | 1.8%(+0.127)#10,234 |
| 19. | 46259 | 1.7% | 1.8%(-0.043)#256 | 1.8%(-0.037)#11,562 |
| 20. | 46226 | 1.6% | 1.8%(-0.224)#290 | 1.8%(-0.218)#13,134 |
| 21. | 46221 | 1.6% | 1.8%(-0.225)#291 | 1.8%(-0.218)#13,136 |
| 22. | 46208 | 1.6% | 1.8%(-0.241)#297 | 1.8%(-0.235)#13,296 |
| 23. | 46237 | 1.5% | 1.8%(-0.255)#300 | 1.8%(-0.249)#13,428 |
| 24. | 46231 | 1.5% | 1.8%(-0.272)#302 | 1.8%(-0.266)#13,594 |
| 25. | 46236 | 1.5% | 1.8%(-0.306)#311 | 1.8%(-0.299)#13,942 |
| 26. | 46219 | 1.3% | 1.8%(-0.449)#337 | 1.8%(-0.442)#15,276 |
| 27. | 46260 | 1.1% | 1.8%(-0.684)#398 | 1.8%(-0.677)#17,511 |
| 28. | 46227 | 1.1% | 1.8%(-0.698)#400 | 1.8%(-0.692)#17,647 |
| 29. | 46216 | 1.1% | 1.8%(-0.703)#401 | 1.8%(-0.696)#17,683 |
| 30. | 46217 | 1.1% | 1.8%(-0.732)#410 | 1.8%(-0.725)#17,945 |
| 31. | 46204 | 0.98% | 1.8%(-0.813)#428 | 1.8%(-0.806)#18,699 |
| 32. | 46278 | 0.80% | 1.8%(-0.994)#472 | 1.8%(-0.988)#20,244 |
| 33. | 46222 | 0.72% | 1.8%(-1.07)#487 | 1.8%(-1.07)#20,854 |
| 34. | 46241 | 0.64% | 1.8%(-1.15)#499 | 1.8%(-1.14)#21,372 |
| 35. | 46218 | 0.54% | 1.8%(-1.25)#519 | 1.8%(-1.24)#22,068 |
| 36. | 46225 | 0.30% | 1.8%(-1.49)#562 | 1.8%(-1.48)#23,431 |
1
Common Questions
What are the Top 10 Zip Codes with the Highest Percentage of Population Employed in Education, Arts & Media in Indianapolis, IN?
Top 10 Zip Codes with the Highest Percentage of Population Employed in Education, Arts & Media in Indianapolis, IN are:
What zip code has the Highest Percentage of Population Employed in Education, Arts & Media in Indianapolis, IN?
46280 has the Highest Percentage of Population Employed in Education, Arts & Media in Indianapolis, IN with 5.1%.
What is the Percentage of Population Employed in Education, Arts & Media in Indianapolis, IN?
Percentage of Population Employed in Education, Arts & Media in Indianapolis is 2.0%.
What is the Percentage of Population Employed in Education, Arts & Media in Indiana?
Percentage of Population Employed in Education, Arts & Media in Indiana is 1.8%.
What is the Percentage of Population Employed in Education, Arts & Media in the United States?
Percentage of Population Employed in Education, Arts & Media in the United States is 1.8%.