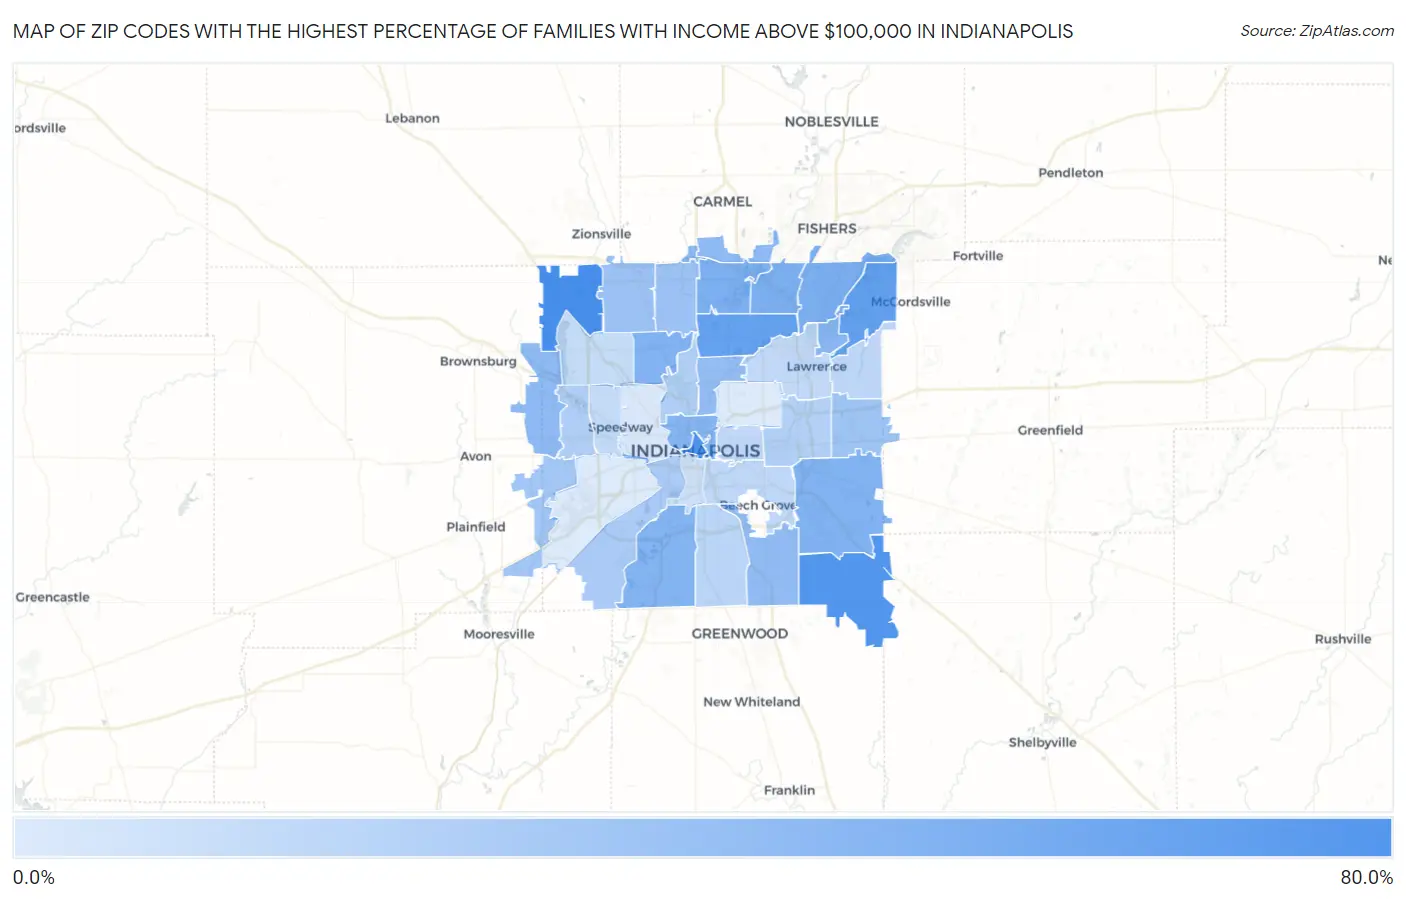
Zip Codes with the Highest Percentage of Families with Income Above $100,000 in Indianapolis, IN
RELATED REPORTS & OPTIONS
Family Income | $100k+
Indianapolis
Compare Zip Codes
Map of Zip Codes with the Highest Percentage of Families with Income Above $100,000 in Indianapolis
14.2%
79.5%
Zip Codes with the Highest Percentage of Families with Income Above $100,000 in Indianapolis, IN
| Zip Code | Families with Income > $100k | vs State | vs National | |
| 1. | 46278 | 79.5% | 40.5%(+39.0)#9 | 46.1%(+33.4)#1,084 |
| 2. | 46204 | 74.7% | 40.5%(+34.2)#13 | 46.1%(+28.6)#1,752 |
| 3. | 46259 | 73.3% | 40.5%(+32.8)#16 | 46.1%(+27.2)#1,985 |
| 4. | 46236 | 65.3% | 40.5%(+24.8)#30 | 46.1%(+19.2)#3,665 |
| 5. | 46220 | 64.2% | 40.5%(+23.7)#35 | 46.1%(+18.1)#3,941 |
| 6. | 46250 | 52.7% | 40.5%(+12.2)#102 | 46.1%(+6.60)#7,660 |
| 7. | 46256 | 52.6% | 40.5%(+12.1)#104 | 46.1%(+6.50)#7,704 |
| 8. | 46240 | 52.5% | 40.5%(+12.0)#106 | 46.1%(+6.40)#7,755 |
| 9. | 46228 | 50.5% | 40.5%(+10.00)#125 | 46.1%(+4.40)#8,616 |
| 10. | 46239 | 50.4% | 40.5%(+9.90)#126 | 46.1%(+4.30)#8,648 |
| 11. | 46217 | 50.0% | 40.5%(+9.50)#130 | 46.1%(+3.90)#8,796 |
| 12. | 46202 | 48.9% | 40.5%(+8.40)#145 | 46.1%(+2.80)#9,312 |
| 13. | 46216 | 47.0% | 40.5%(+6.50)#172 | 46.1%(+0.900)#10,310 |
| 14. | 46290 | 46.2% | 40.5%(+5.70)#180 | 46.1%(+0.100)#10,742 |
| 15. | 46280 | 45.1% | 40.5%(+4.60)#195 | 46.1%(-1.00)#11,286 |
| 16. | 46234 | 44.6% | 40.5%(+4.10)#203 | 46.1%(-1.50)#11,563 |
| 17. | 46237 | 43.5% | 40.5%(+3.00)#221 | 46.1%(-2.60)#12,167 |
| 18. | 46205 | 42.8% | 40.5%(+2.30)#232 | 46.1%(-3.30)#12,615 |
| 19. | 46268 | 39.9% | 40.5%(-0.600)#295 | 46.1%(-6.20)#14,480 |
| 20. | 46260 | 39.8% | 40.5%(-0.700)#296 | 46.1%(-6.30)#14,542 |
| 21. | 46229 | 37.8% | 40.5%(-2.70)#338 | 46.1%(-8.30)#15,895 |
| 22. | 46231 | 35.8% | 40.5%(-4.70)#381 | 46.1%(-10.3)#17,350 |
| 23. | 46221 | 33.2% | 40.5%(-7.30)#438 | 46.1%(-12.9)#19,166 |
| 24. | 46214 | 30.8% | 40.5%(-9.70)#490 | 46.1%(-15.3)#20,851 |
| 25. | 46208 | 30.4% | 40.5%(-10.1)#497 | 46.1%(-15.7)#21,122 |
| 26. | 46219 | 29.0% | 40.5%(-11.5)#527 | 46.1%(-17.1)#22,100 |
| 27. | 46227 | 27.0% | 40.5%(-13.5)#560 | 46.1%(-19.1)#23,409 |
| 28. | 46235 | 26.1% | 40.5%(-14.4)#572 | 46.1%(-20.0)#24,005 |
| 29. | 46203 | 25.2% | 40.5%(-15.3)#592 | 46.1%(-20.9)#24,588 |
| 30. | 46201 | 24.0% | 40.5%(-16.5)#613 | 46.1%(-22.1)#25,279 |
| 31. | 46226 | 23.8% | 40.5%(-16.7)#617 | 46.1%(-22.3)#25,380 |
| 32. | 46224 | 23.1% | 40.5%(-17.4)#628 | 46.1%(-23.0)#25,736 |
| 33. | 46254 | 22.8% | 40.5%(-17.7)#634 | 46.1%(-23.3)#25,890 |
| 34. | 46225 | 18.7% | 40.5%(-21.8)#676 | 46.1%(-27.4)#27,824 |
| 35. | 46222 | 15.1% | 40.5%(-25.4)#698 | 46.1%(-31.0)#29,069 |
| 36. | 46218 | 14.5% | 40.5%(-26.0)#702 | 46.1%(-31.6)#29,251 |
| 37. | 46241 | 14.2% | 40.5%(-26.3)#706 | 46.1%(-31.9)#29,353 |
1
Common Questions
What are the Top 10 Zip Codes with the Highest Percentage of Families with Income Above $100,000 in Indianapolis, IN?
Top 10 Zip Codes with the Highest Percentage of Families with Income Above $100,000 in Indianapolis, IN are:
What zip code has the Highest Percentage of Families with Income Above $100,000 in Indianapolis, IN?
46278 has the Highest Percentage of Families with Income Above $100,000 in Indianapolis, IN with 79.5%.
What is the Percentage of Families with Income Above $100,000 in Indianapolis, IN?
Percentage of Families with Income Above $100,000 in Indianapolis is 36.1%.
What is the Percentage of Families with Income Above $100,000 in Indiana?
Percentage of Families with Income Above $100,000 in Indiana is 40.5%.
What is the Percentage of Families with Income Above $100,000 in the United States?
Percentage of Families with Income Above $100,000 in the United States is 46.1%.