Zip Codes with the Highest Percentage of Households Heated by Bottled Gas / Liquid Propane in Indianapolis, IN
RELATED REPORTS & OPTIONS
Bottled Gas / LP Heating
Indianapolis
Compare Zip Codes
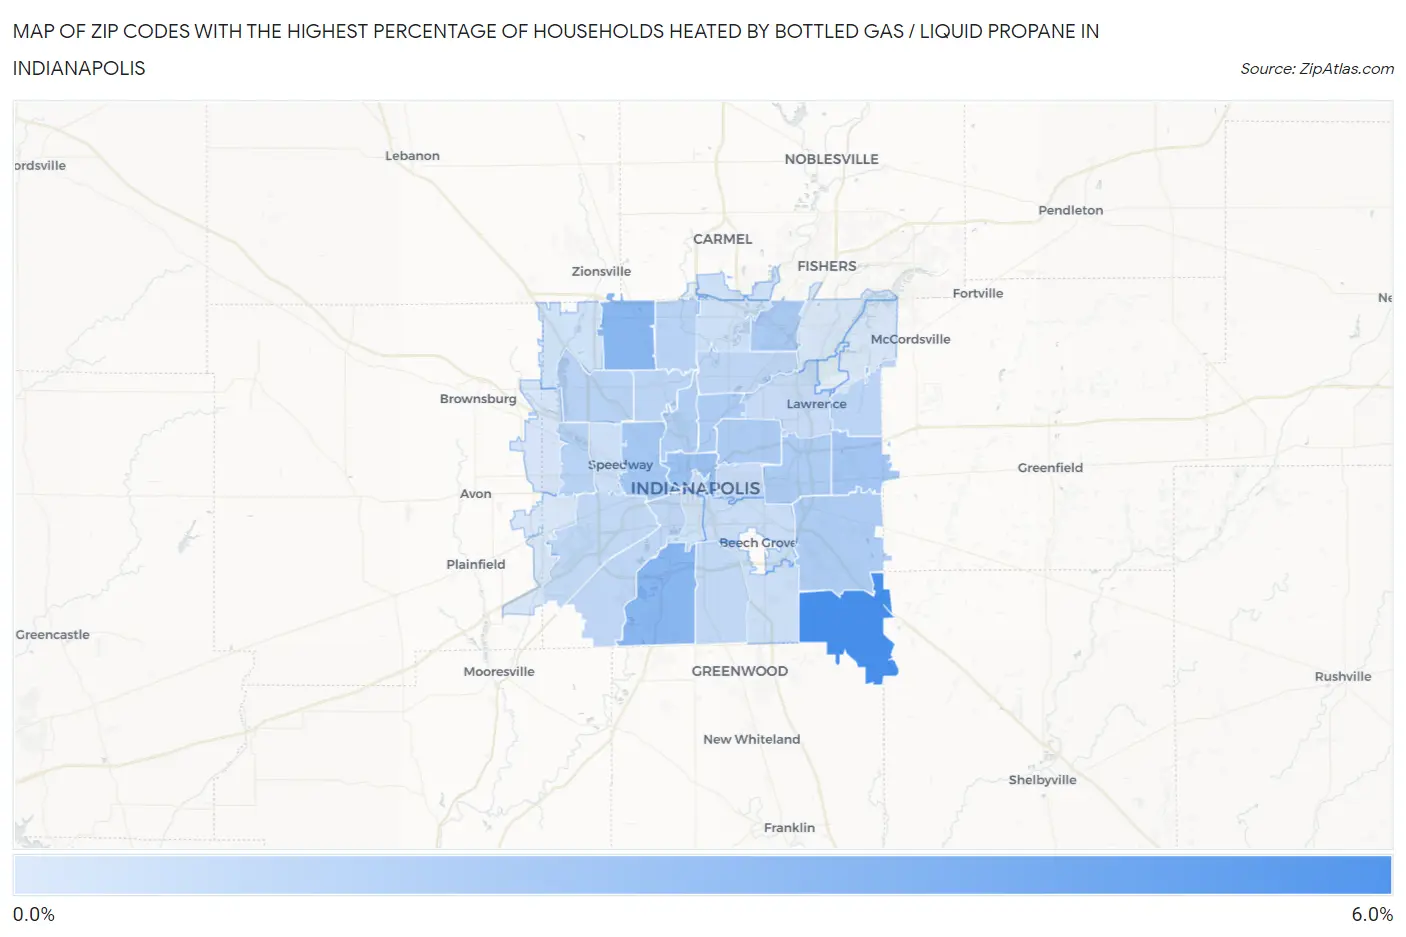
Map of Zip Codes with the Highest Percentage of Households Heated by Bottled Gas / Liquid Propane in Indianapolis
0.20%
5.9%
Zip Codes with the Highest Percentage of Households Heated by Bottled Gas / Liquid Propane in Indianapolis, IN
| Zip Code | Bottled Gas / LP Heating | vs State | vs National | |
| 1. | 46259 | 5.9% | 7.3%(-1.40)#524 | 4.9%(+1.00)#17,667 |
| 2. | 46217 | 3.3% | 7.3%(-4.00)#567 | 4.9%(-1.60)#20,521 |
| 3. | 46268 | 3.3% | 7.3%(-4.00)#568 | 4.9%(-1.60)#20,546 |
| 4. | 46202 | 2.5% | 7.3%(-4.80)#585 | 4.9%(-2.40)#21,974 |
| 5. | 46229 | 2.3% | 7.3%(-5.00)#592 | 4.9%(-2.60)#22,398 |
| 6. | 46222 | 2.2% | 7.3%(-5.10)#600 | 4.9%(-2.70)#22,601 |
| 7. | 46250 | 2.0% | 7.3%(-5.30)#608 | 4.9%(-2.90)#23,245 |
| 8. | 46218 | 1.9% | 7.3%(-5.40)#610 | 4.9%(-3.00)#23,467 |
| 9. | 46219 | 1.8% | 7.3%(-5.50)#614 | 4.9%(-3.10)#23,699 |
| 10. | 46239 | 1.8% | 7.3%(-5.50)#615 | 4.9%(-3.10)#23,723 |
| 11. | 46205 | 1.8% | 7.3%(-5.50)#616 | 4.9%(-3.10)#23,753 |
| 12. | 46208 | 1.7% | 7.3%(-5.60)#619 | 4.9%(-3.20)#24,078 |
| 13. | 46254 | 1.4% | 7.3%(-5.90)#630 | 4.9%(-3.50)#25,023 |
| 14. | 46260 | 1.4% | 7.3%(-5.90)#631 | 4.9%(-3.50)#25,064 |
| 15. | 46214 | 1.4% | 7.3%(-5.90)#634 | 4.9%(-3.50)#25,143 |
| 16. | 46235 | 1.3% | 7.3%(-6.00)#643 | 4.9%(-3.60)#25,429 |
| 17. | 46228 | 1.3% | 7.3%(-6.00)#650 | 4.9%(-3.60)#25,596 |
| 18. | 46220 | 1.2% | 7.3%(-6.10)#652 | 4.9%(-3.70)#25,815 |
| 19. | 46221 | 1.2% | 7.3%(-6.10)#653 | 4.9%(-3.70)#25,891 |
| 20. | 46227 | 1.1% | 7.3%(-6.20)#660 | 4.9%(-3.80)#26,132 |
| 21. | 46241 | 1.1% | 7.3%(-6.20)#665 | 4.9%(-3.80)#26,224 |
| 22. | 46226 | 0.90% | 7.3%(-6.40)#680 | 4.9%(-4.00)#26,986 |
| 23. | 46201 | 0.90% | 7.3%(-6.40)#682 | 4.9%(-4.00)#27,078 |
| 24. | 46203 | 0.80% | 7.3%(-6.50)#687 | 4.9%(-4.10)#27,433 |
| 25. | 46237 | 0.70% | 7.3%(-6.60)#689 | 4.9%(-4.20)#27,794 |
| 26. | 46204 | 0.70% | 7.3%(-6.60)#693 | 4.9%(-4.20)#28,024 |
| 27. | 46224 | 0.60% | 7.3%(-6.70)#696 | 4.9%(-4.30)#28,176 |
| 28. | 46240 | 0.60% | 7.3%(-6.70)#697 | 4.9%(-4.30)#28,318 |
| 29. | 46280 | 0.60% | 7.3%(-6.70)#698 | 4.9%(-4.30)#28,399 |
| 30. | 46278 | 0.50% | 7.3%(-6.80)#705 | 4.9%(-4.40)#28,733 |
| 31. | 46225 | 0.50% | 7.3%(-6.80)#706 | 4.9%(-4.40)#28,752 |
| 32. | 46234 | 0.30% | 7.3%(-7.00)#712 | 4.9%(-4.60)#29,154 |
| 33. | 46236 | 0.20% | 7.3%(-7.10)#714 | 4.9%(-4.70)#29,391 |
| 34. | 46256 | 0.20% | 7.3%(-7.10)#715 | 4.9%(-4.70)#29,410 |
| 35. | 46231 | 0.20% | 7.3%(-7.10)#717 | 4.9%(-4.70)#29,462 |
1
Common Questions
What are the Top 10 Zip Codes with the Highest Percentage of Households Heated by Bottled Gas / Liquid Propane in Indianapolis, IN?
Top 10 Zip Codes with the Highest Percentage of Households Heated by Bottled Gas / Liquid Propane in Indianapolis, IN are:
What zip code has the Highest Percentage of Households Heated by Bottled Gas / Liquid Propane in Indianapolis, IN?
46259 has the Highest Percentage of Households Heated by Bottled Gas / Liquid Propane in Indianapolis, IN with 5.9%.
What is the Percentage of Households Heated by Bottled Gas / Liquid Propane in Indianapolis, IN?
Percentage of Households Heated by Bottled Gas / Liquid Propane in Indianapolis is 1.4%.
What is the Percentage of Households Heated by Bottled Gas / Liquid Propane in Indiana?
Percentage of Households Heated by Bottled Gas / Liquid Propane in Indiana is 7.3%.
What is the Percentage of Households Heated by Bottled Gas / Liquid Propane in the United States?
Percentage of Households Heated by Bottled Gas / Liquid Propane in the United States is 4.9%.