Zip Codes with the Highest Percentage of Population Employed in Finance & Insurance in Indianapolis, IN
RELATED REPORTS & OPTIONS
Finance & Insurance
Indianapolis
Compare Zip Codes
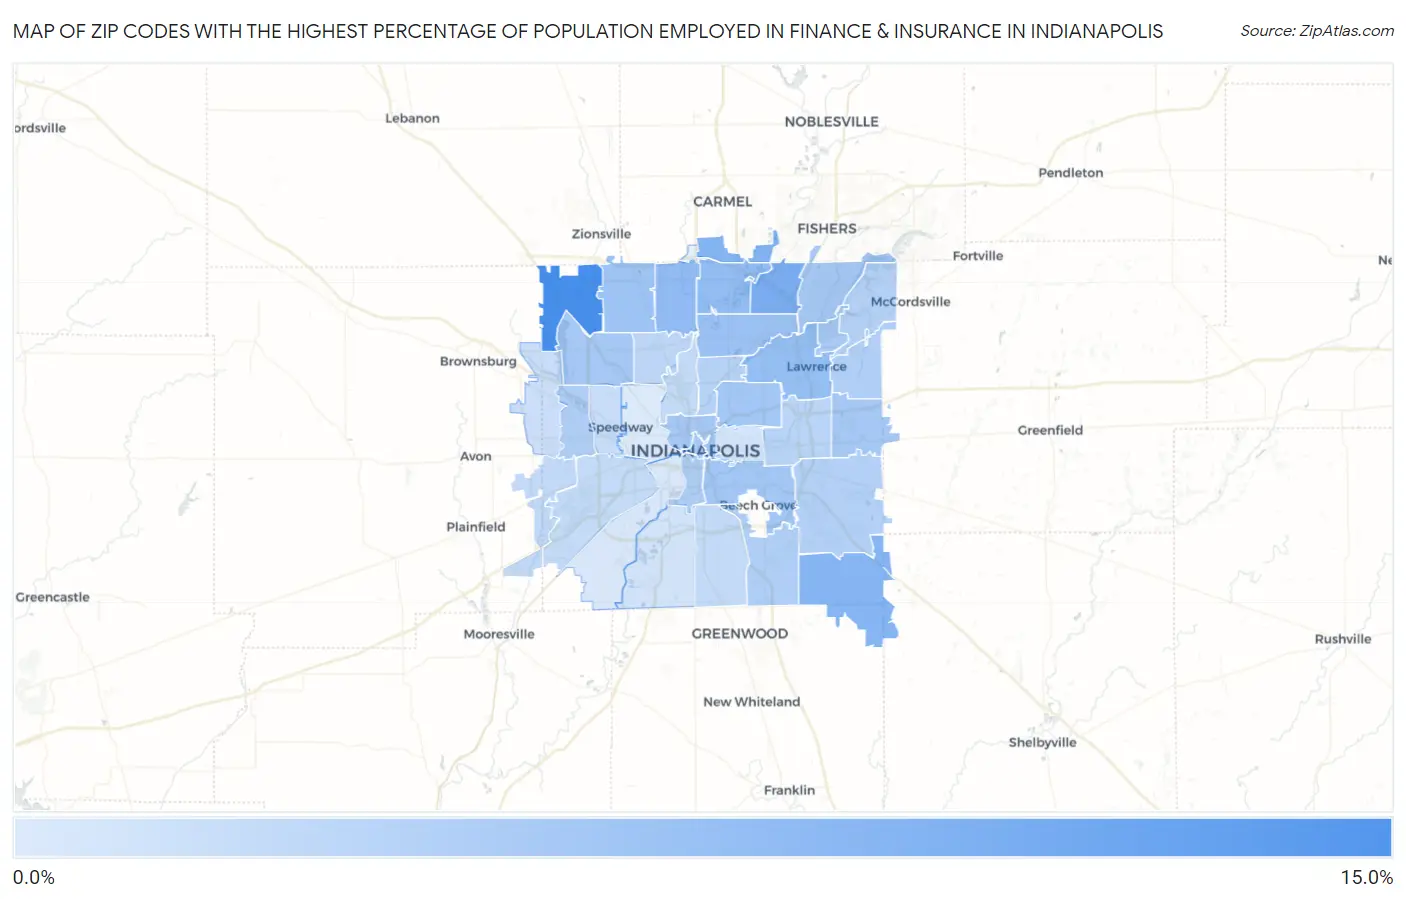
Map of Zip Codes with the Highest Percentage of Population Employed in Finance & Insurance in Indianapolis
1.9%
11.5%
Zip Codes with the Highest Percentage of Population Employed in Finance & Insurance in Indianapolis, IN
| Zip Code | % Employed | vs State | vs National | |
| 1. | 46278 | 11.5% | 3.8%(+7.65)#12 | 4.8%(+6.72)#1,144 |
| 2. | 46250 | 8.2% | 3.8%(+4.34)#36 | 4.8%(+3.41)#2,916 |
| 3. | 46280 | 7.5% | 3.8%(+3.69)#46 | 4.8%(+2.76)#3,570 |
| 4. | 46259 | 7.4% | 3.8%(+3.57)#47 | 4.8%(+2.64)#3,701 |
| 5. | 46260 | 6.7% | 3.8%(+2.88)#58 | 4.8%(+1.95)#4,633 |
| 6. | 46240 | 6.5% | 3.8%(+2.71)#62 | 4.8%(+1.78)#4,899 |
| 7. | 46226 | 6.3% | 3.8%(+2.46)#71 | 4.8%(+1.53)#5,314 |
| 8. | 46220 | 5.9% | 3.8%(+2.05)#89 | 4.8%(+1.12)#6,104 |
| 9. | 46268 | 5.8% | 3.8%(+2.01)#91 | 4.8%(+1.08)#6,187 |
| 10. | 46203 | 5.6% | 3.8%(+1.71)#98 | 4.8%(+0.783)#6,865 |
| 11. | 46218 | 5.5% | 3.8%(+1.69)#100 | 4.8%(+0.755)#6,920 |
| 12. | 46256 | 5.4% | 3.8%(+1.53)#108 | 4.8%(+0.602)#7,291 |
| 13. | 46229 | 5.3% | 3.8%(+1.51)#110 | 4.8%(+0.582)#7,342 |
| 14. | 46254 | 5.3% | 3.8%(+1.51)#111 | 4.8%(+0.576)#7,362 |
| 15. | 46202 | 5.3% | 3.8%(+1.49)#112 | 4.8%(+0.560)#7,400 |
| 16. | 46216 | 5.0% | 3.8%(+1.18)#132 | 4.8%(+0.247)#8,242 |
| 17. | 46204 | 4.9% | 3.8%(+1.11)#133 | 4.8%(+0.180)#8,448 |
| 18. | 46214 | 4.8% | 3.8%(+0.913)#150 | 4.8%(-0.017)#9,053 |
| 19. | 46225 | 4.7% | 3.8%(+0.877)#152 | 4.8%(-0.053)#9,179 |
| 20. | 46235 | 4.6% | 3.8%(+0.722)#160 | 4.8%(-0.208)#9,649 |
| 21. | 46237 | 4.6% | 3.8%(+0.718)#161 | 4.8%(-0.212)#9,662 |
| 22. | 46239 | 4.4% | 3.8%(+0.575)#175 | 4.8%(-0.355)#10,138 |
| 23. | 46205 | 4.4% | 3.8%(+0.562)#177 | 4.8%(-0.368)#10,180 |
| 24. | 46236 | 4.3% | 3.8%(+0.500)#184 | 4.8%(-0.430)#10,407 |
| 25. | 46219 | 4.1% | 3.8%(+0.256)#201 | 4.8%(-0.674)#11,219 |
| 26. | 46228 | 3.9% | 3.8%(+0.108)#208 | 4.8%(-0.822)#11,806 |
| 27. | 46231 | 3.7% | 3.8%(-0.156)#231 | 4.8%(-1.09)#12,836 |
| 28. | 46208 | 3.5% | 3.8%(-0.340)#245 | 4.8%(-1.27)#13,598 |
| 29. | 46227 | 3.5% | 3.8%(-0.344)#247 | 4.8%(-1.27)#13,626 |
| 30. | 46241 | 3.5% | 3.8%(-0.386)#253 | 4.8%(-1.32)#13,812 |
| 31. | 46224 | 3.2% | 3.8%(-0.665)#292 | 4.8%(-1.60)#15,057 |
| 32. | 46234 | 3.1% | 3.8%(-0.786)#311 | 4.8%(-1.72)#15,586 |
| 33. | 46217 | 2.7% | 3.8%(-1.19)#362 | 4.8%(-2.12)#17,456 |
| 34. | 46201 | 2.5% | 3.8%(-1.34)#372 | 4.8%(-2.27)#18,203 |
| 35. | 46221 | 2.1% | 3.8%(-1.69)#420 | 4.8%(-2.62)#19,842 |
| 36. | 46222 | 1.9% | 3.8%(-1.92)#453 | 4.8%(-2.85)#20,851 |
1
Common Questions
What are the Top 10 Zip Codes with the Highest Percentage of Population Employed in Finance & Insurance in Indianapolis, IN?
Top 10 Zip Codes with the Highest Percentage of Population Employed in Finance & Insurance in Indianapolis, IN are:
What zip code has the Highest Percentage of Population Employed in Finance & Insurance in Indianapolis, IN?
46278 has the Highest Percentage of Population Employed in Finance & Insurance in Indianapolis, IN with 11.5%.
What is the Percentage of Population Employed in Finance & Insurance in Indianapolis, IN?
Percentage of Population Employed in Finance & Insurance in Indianapolis is 4.6%.
What is the Percentage of Population Employed in Finance & Insurance in Indiana?
Percentage of Population Employed in Finance & Insurance in Indiana is 3.8%.
What is the Percentage of Population Employed in Finance & Insurance in the United States?
Percentage of Population Employed in Finance & Insurance in the United States is 4.8%.