Zip Codes with the Highest Percentage of Scotch-Irish Population in Indianapolis, IN

RELATED REPORTS & OPTIONS

Scotch-Irish
Population
Families and Households
Female Fertility
Female Fertility (Unmarried)
Race (Community Size)
Race (Percentage)
Ancestry (Community Size)
AfghanAfricanAlaskan AthabascanAlbanianAlsatianAmericanApacheArabArgentineanArmenianAustralianAustrianBahamianBangladeshiBarbadianBasqueBelgianBelizeanBhutaneseBlackfeetBolivianBrazilianBritishBritish West IndianBulgarianBurmeseCajunCanadianCelticCentral AmericanCentral American IndianCherokeeChickasawChileanChippewaChoctawColombianCosta RicanCroatianCrowCubanCzechCzechoslovakianDanishDominicanDutchEastern EuropeanEcuadorianEgyptianEnglishEstonianEthiopianEuropeanFilipinoFinnishFrenchFrench CanadianGermanGerman RussianGhanaianGreekGuamanian / ChamorroGuatemalanGuyaneseHaitianHonduranHopiHungarianIcelanderIndian (Asian)IndonesianInupiatIranianIraqiIrishIroquoisIsraeliItalianJamaicanJapaneseJordanianKenyanKoreanLaotianLatvianLebaneseLiberianLithuanianLuxembourgerMacedonianMalaysianMenomineeMexicanMexican American IndianMongolianMoroccanNative HawaiianNavajoNew ZealanderNicaraguanNigerianNorthern EuropeanNorwegianPakistaniPalestinianPanamanianPennsylvania GermanPeruvianPolishPortuguesePotawatomiPuerto RicanRomanianRussianSalvadoranSamoanScandinavianScotch-IrishScottishSeminoleSenegaleseSerbianSierra LeoneanSiouxSlavicSlovakSloveneSouth AfricanSouth AmericanSouth American IndianSpaniardSpanishSri LankanSubsaharan AfricanSudaneseSwedishSwissSyrianThaiTonganTrinidadian and TobagonianTurkishUgandanUkrainianUruguayanVenezuelanVietnameseWelshWest IndianYugoslavianZimbabwean
Ancestry (Percentage)
AfghanAfricanAlaskan AthabascanAlbanianAlsatianAmericanApacheArabArgentineanArmenianAustralianAustrianBahamianBangladeshiBarbadianBasqueBelgianBelizeanBhutaneseBlackfeetBolivianBrazilianBritishBritish West IndianBulgarianBurmeseCajunCanadianCelticCentral AmericanCentral American IndianCherokeeChickasawChileanChippewaChoctawColombianCosta RicanCroatianCrowCubanCzechCzechoslovakianDanishDominicanDutchEastern EuropeanEcuadorianEgyptianEnglishEstonianEthiopianEuropeanFilipinoFinnishFrenchFrench CanadianGermanGerman RussianGhanaianGreekGuamanian / ChamorroGuatemalanGuyaneseHaitianHonduranHopiHungarianIcelanderIndian (Asian)IndonesianInupiatIranianIraqiIrishIroquoisIsraeliItalianJamaicanJapaneseJordanianKenyanKoreanLaotianLatvianLebaneseLiberianLithuanianLuxembourgerMacedonianMalaysianMenomineeMexicanMexican American IndianMongolianMoroccanNative HawaiianNavajoNew ZealanderNicaraguanNigerianNorthern EuropeanNorwegianPakistaniPalestinianPanamanianPennsylvania GermanPeruvianPolishPortuguesePotawatomiPuerto RicanRomanianRussianSalvadoranSamoanScandinavianScotch-IrishScottishSeminoleSenegaleseSerbianSierra LeoneanSiouxSlavicSlovakSloveneSouth AfricanSouth AmericanSouth American IndianSpaniardSpanishSri LankanSubsaharan AfricanSudaneseSwedishSwissSyrianThaiTonganTrinidadian and TobagonianTurkishUgandanUkrainianUruguayanVenezuelanVietnameseWelshWest IndianYugoslavianZimbabwean
Immigrant Origin (Total)
AfghanistanAfricaArgentinaAsiaAustraliaAustriaBahamasBangladeshBarbadosBelarusBoliviaBosnia and HerzegovinaBrazilBulgariaBurma / MyanmarCambodiaCameroonCanadaCaribbeanCentral AmericaChileChinaColombiaCongoCosta RicaCubaDenmarkDominican RepublicEastern AfricaEastern AsiaEastern EuropeEcuadorEgyptEl SalvadorEnglandEritreaEthiopiaEuropeFranceGermanyGhanaGreeceGuatemalaGuyanaHaitiHondurasHong KongHungaryIndiaIndonesiaIranIraqIrelandIsraelItalyJamaicaJapanJordanKenyaKoreaLaosLatin AmericaLatviaLebanonLiberiaMalaysiaMexicoMiddle AfricaMoldovaMoroccoNepalNetherlandsNicaraguaNigeriaNorth MacedoniaNorthern AfricaNorthern EuropeNorwayOceaniaPakistanPanamaPeruPhilippinesPolandPortugalRomaniaRussiaSaudi ArabiaScotlandSenegalSerbiaSierra LeoneSingaporeSouth AfricaSouth AmericaSouth Central AsiaSouth Eastern AsiaSouthern EuropeSpainSt. Vincent and the GrenadinesSudanSyriaTaiwanThailandTrinidad and TobagoTurkeyUgandaUkraineUzbekistanVenezuelaVietnamWest IndiesWestern AfricaWestern AsiaWestern EuropeYemenZaireZimbabwe
Immigrant Origin (Percentage)
AfghanistanAfricaArgentinaAsiaAustraliaAustriaBahamasBangladeshBarbadosBelarusBoliviaBosnia and HerzegovinaBrazilBulgariaBurma / MyanmarCambodiaCameroonCanadaCaribbeanCentral AmericaChileChinaColombiaCongoCosta RicaCubaDenmarkDominican RepublicEastern AfricaEastern AsiaEastern EuropeEcuadorEgyptEl SalvadorEnglandEritreaEthiopiaEuropeFranceGermanyGhanaGreeceGuatemalaGuyanaHaitiHondurasHong KongHungaryIndiaIndonesiaIranIraqIrelandIsraelItalyJamaicaJapanJordanKenyaKoreaLaosLatin AmericaLatviaLebanonLiberiaMalaysiaMexicoMiddle AfricaMoldovaMoroccoNepalNetherlandsNicaraguaNigeriaNorth MacedoniaNorthern AfricaNorthern EuropeNorwayOceaniaPakistanPanamaPeruPhilippinesPolandPortugalRomaniaRussiaSaudi ArabiaScotlandSenegalSerbiaSierra LeoneSingaporeSouth AfricaSouth AmericaSouth Central AsiaSouth Eastern AsiaSouthern EuropeSpainSt. Vincent and the GrenadinesSudanSyriaTaiwanThailandTrinidad and TobagoTurkeyUgandaUkraineUzbekistanVenezuelaVietnamWest IndiesWestern AfricaWestern AsiaWestern EuropeYemenZaireZimbabwe
Income
Income (Families)
Income (Households)
Poverty
Poverty (Families)
Unemployment
Employment Occupations
Employment Industries
Employer Class
Commute Time
Commute Means
School Enrollment
Education by Degree Field
Occupancy
Finances
Physical Characteristics
Indianapolis
Compare Zip Codes
Comparison Subject

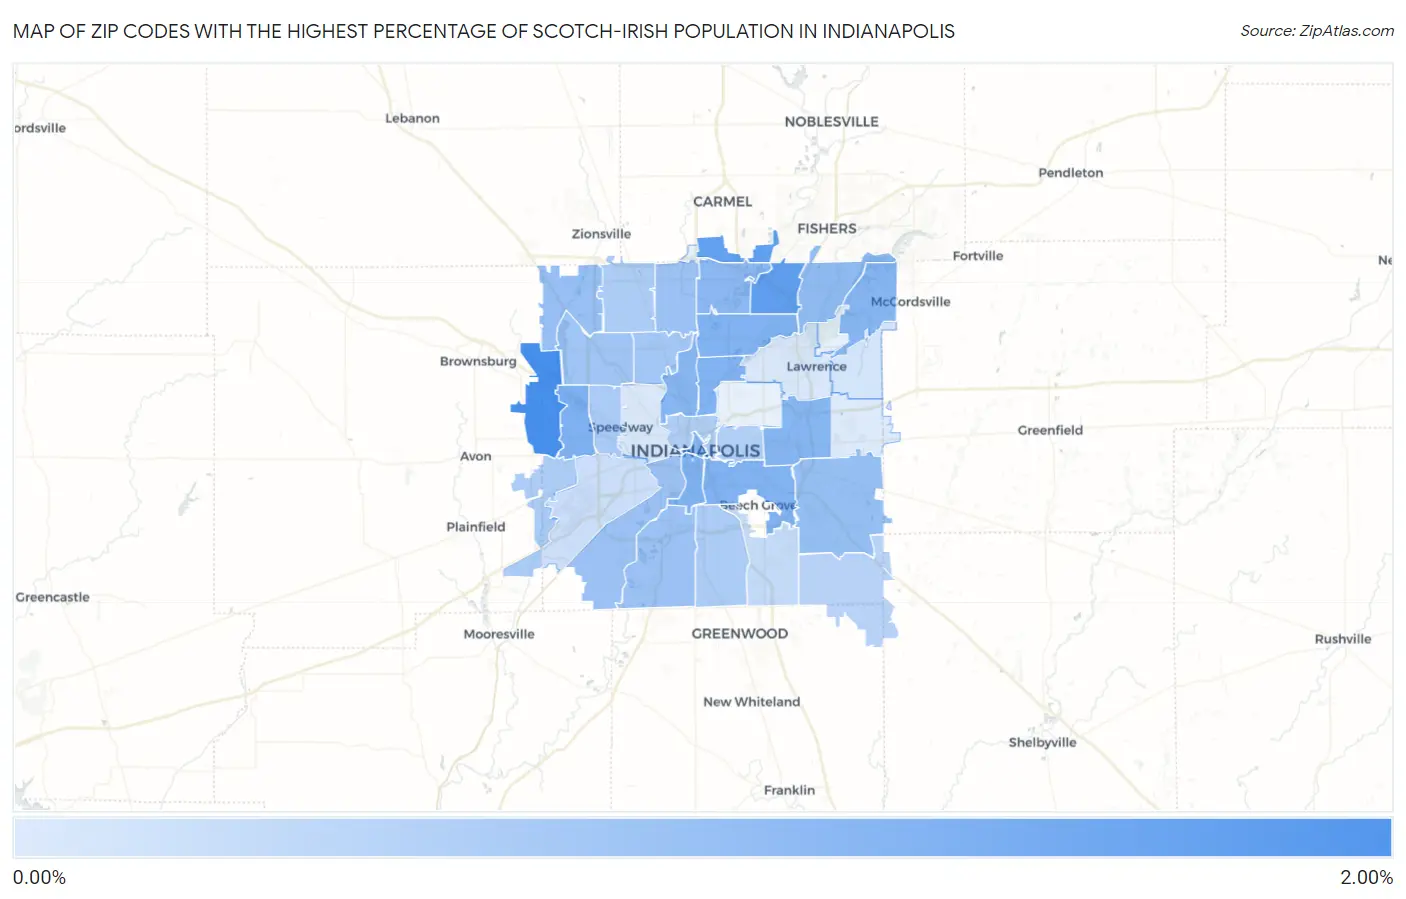
Map of Zip Codes with the Highest Percentage of Scotch-Irish Population in Indianapolis

0.00%
2.00%
Zip Codes with the Highest Percentage of Scotch-Irish Population in Indianapolis Map

Zip Codes with the Highest Percentage of Scotch-Irish Population in Indianapolis, IN

Zip Code Scotch-Irish vs State vs National
1.462341.56%0.73%(+0.823)#840.82%(+0.738)#5,624
2.462501.31%0.73%(+0.575)#1160.82%(+0.490)#7,160
3.462801.28%0.73%(+0.547)#1210.82%(+0.462)#7,363
4.462141.02%0.73%(+0.284)#1700.82%(+0.199)#9,572
5.462031.00%0.73%(+0.271)#1720.82%(+0.186)#9,699
6.462251.00%0.73%(+0.264)#1760.82%(+0.179)#9,781
7.462200.99%0.73%(+0.262)#1770.82%(+0.177)#9,808
8.462050.99%0.73%(+0.259)#1780.82%(+0.174)#9,827
9.462080.94%0.73%(+0.209)#1950.82%(+0.124)#10,357
10.462040.94%0.73%(+0.206)#1970.82%(+0.121)#10,392
11.462360.93%0.73%(+0.201)#1980.82%(+0.116)#10,449
12.462190.92%0.73%(+0.190)#2020.82%(+0.105)#10,566
13.462400.89%0.73%(+0.157)#2180.82%(+0.072)#10,949
14.462560.83%0.73%(+0.098)#2340.82%(+0.014)#11,647
15.462390.79%0.73%(+0.057)#2540.82%(-0.028)#12,205
16.462780.77%0.73%(+0.042)#2610.82%(-0.043)#12,377
17.462600.75%0.73%(+0.018)#2680.82%(-0.067)#12,689
18.462210.74%0.73%(+0.010)#2720.82%(-0.074)#12,790
19.462170.72%0.73%(-0.011)#2850.82%(-0.096)#13,122
20.462540.68%0.73%(-0.057)#2970.82%(-0.142)#13,734
21.462280.67%0.73%(-0.062)#3040.82%(-0.147)#13,822
22.462240.59%0.73%(-0.141)#3440.82%(-0.226)#14,956
23.462680.58%0.73%(-0.148)#3470.82%(-0.233)#15,071
24.462270.58%0.73%(-0.150)#3490.82%(-0.235)#15,101
25.462310.58%0.73%(-0.153)#3530.82%(-0.238)#15,141
26.462020.56%0.73%(-0.177)#3650.82%(-0.262)#15,511
27.462010.50%0.73%(-0.231)#3890.82%(-0.316)#16,397
28.462590.48%0.73%(-0.258)#4040.82%(-0.343)#16,820
29.462370.36%0.73%(-0.375)#4630.82%(-0.460)#18,768
30.462410.30%0.73%(-0.436)#4910.82%(-0.521)#19,798
31.462350.20%0.73%(-0.532)#5280.82%(-0.617)#21,434
32.462220.16%0.73%(-0.574)#5450.82%(-0.659)#22,150
33.462260.16%0.73%(-0.575)#5460.82%(-0.660)#22,174
34.462290.11%0.73%(-0.621)#5590.82%(-0.706)#22,889

Common Questions

What are the Top 10 Zip Codes with the Highest Percentage of Scotch-Irish Population in Indianapolis, IN?
Top 10 Zip Codes with the Highest Percentage of Scotch-Irish Population in Indianapolis, IN are:
#1
1.56%
#2
1.31%
#3
1.28%
#4
1.02%
#5
1.00%
#6
1.00%
#7
0.99%
#8
0.99%
#9
0.94%
#10
0.94%
What zip code has the Highest Percentage of Scotch-Irish Population in Indianapolis, IN?
46234 has the Highest Percentage of Scotch-Irish Population in Indianapolis, IN with 1.56%.
What is the Percentage of Scotch-Irish Population in Indianapolis, IN?
Percentage of Scotch-Irish Population in Indianapolis is 0.66%.
What is the Percentage of Scotch-Irish Population in Indiana?
Percentage of Scotch-Irish Population in Indiana is 0.73%.
What is the Percentage of Scotch-Irish Population in the United States?
Percentage of Scotch-Irish Population in the United States is 0.82%.