Zip Codes with the Highest Percentage of Households with Income Above $100,000 in Indianapolis, IN

RELATED REPORTS & OPTIONS

Household Income | $100k+
Population
Families and Households
Female Fertility
Female Fertility (Unmarried)
Race (Community Size)
Race (Percentage)
Ancestry (Community Size)
AfghanAfricanAlaskan AthabascanAlbanianAlsatianAmericanApacheArabArgentineanArmenianAustralianAustrianBahamianBangladeshiBarbadianBasqueBelgianBelizeanBhutaneseBlackfeetBolivianBrazilianBritishBritish West IndianBulgarianBurmeseCajunCanadianCelticCentral AmericanCentral American IndianCherokeeChickasawChileanChippewaChoctawColombianCosta RicanCroatianCrowCubanCzechCzechoslovakianDanishDominicanDutchEastern EuropeanEcuadorianEgyptianEnglishEstonianEthiopianEuropeanFilipinoFinnishFrenchFrench CanadianGermanGerman RussianGhanaianGreekGuamanian / ChamorroGuatemalanGuyaneseHaitianHonduranHopiHungarianIcelanderIndian (Asian)IndonesianInupiatIranianIraqiIrishIroquoisIsraeliItalianJamaicanJapaneseJordanianKenyanKoreanLaotianLatvianLebaneseLiberianLithuanianLuxembourgerMacedonianMalaysianMenomineeMexicanMexican American IndianMongolianMoroccanNative HawaiianNavajoNew ZealanderNicaraguanNigerianNorthern EuropeanNorwegianPakistaniPalestinianPanamanianPennsylvania GermanPeruvianPolishPortuguesePotawatomiPuerto RicanRomanianRussianSalvadoranSamoanScandinavianScotch-IrishScottishSeminoleSenegaleseSerbianSierra LeoneanSiouxSlavicSlovakSloveneSouth AfricanSouth AmericanSouth American IndianSpaniardSpanishSri LankanSubsaharan AfricanSudaneseSwedishSwissSyrianThaiTonganTrinidadian and TobagonianTurkishUgandanUkrainianUruguayanVenezuelanVietnameseWelshWest IndianYugoslavianZimbabwean
Ancestry (Percentage)
AfghanAfricanAlaskan AthabascanAlbanianAlsatianAmericanApacheArabArgentineanArmenianAustralianAustrianBahamianBangladeshiBarbadianBasqueBelgianBelizeanBhutaneseBlackfeetBolivianBrazilianBritishBritish West IndianBulgarianBurmeseCajunCanadianCelticCentral AmericanCentral American IndianCherokeeChickasawChileanChippewaChoctawColombianCosta RicanCroatianCrowCubanCzechCzechoslovakianDanishDominicanDutchEastern EuropeanEcuadorianEgyptianEnglishEstonianEthiopianEuropeanFilipinoFinnishFrenchFrench CanadianGermanGerman RussianGhanaianGreekGuamanian / ChamorroGuatemalanGuyaneseHaitianHonduranHopiHungarianIcelanderIndian (Asian)IndonesianInupiatIranianIraqiIrishIroquoisIsraeliItalianJamaicanJapaneseJordanianKenyanKoreanLaotianLatvianLebaneseLiberianLithuanianLuxembourgerMacedonianMalaysianMenomineeMexicanMexican American IndianMongolianMoroccanNative HawaiianNavajoNew ZealanderNicaraguanNigerianNorthern EuropeanNorwegianPakistaniPalestinianPanamanianPennsylvania GermanPeruvianPolishPortuguesePotawatomiPuerto RicanRomanianRussianSalvadoranSamoanScandinavianScotch-IrishScottishSeminoleSenegaleseSerbianSierra LeoneanSiouxSlavicSlovakSloveneSouth AfricanSouth AmericanSouth American IndianSpaniardSpanishSri LankanSubsaharan AfricanSudaneseSwedishSwissSyrianThaiTonganTrinidadian and TobagonianTurkishUgandanUkrainianUruguayanVenezuelanVietnameseWelshWest IndianYugoslavianZimbabwean
Immigrant Origin (Total)
AfghanistanAfricaArgentinaAsiaAustraliaAustriaBahamasBangladeshBarbadosBelarusBoliviaBosnia and HerzegovinaBrazilBulgariaBurma / MyanmarCambodiaCameroonCanadaCaribbeanCentral AmericaChileChinaColombiaCongoCosta RicaCubaDenmarkDominican RepublicEastern AfricaEastern AsiaEastern EuropeEcuadorEgyptEl SalvadorEnglandEritreaEthiopiaEuropeFranceGermanyGhanaGreeceGuatemalaGuyanaHaitiHondurasHong KongHungaryIndiaIndonesiaIranIraqIrelandIsraelItalyJamaicaJapanJordanKenyaKoreaLaosLatin AmericaLatviaLebanonLiberiaMalaysiaMexicoMiddle AfricaMoldovaMoroccoNepalNetherlandsNicaraguaNigeriaNorth MacedoniaNorthern AfricaNorthern EuropeNorwayOceaniaPakistanPanamaPeruPhilippinesPolandPortugalRomaniaRussiaSaudi ArabiaScotlandSenegalSerbiaSierra LeoneSingaporeSouth AfricaSouth AmericaSouth Central AsiaSouth Eastern AsiaSouthern EuropeSpainSt. Vincent and the GrenadinesSudanSyriaTaiwanThailandTrinidad and TobagoTurkeyUgandaUkraineUzbekistanVenezuelaVietnamWest IndiesWestern AfricaWestern AsiaWestern EuropeYemenZaireZimbabwe
Immigrant Origin (Percentage)
AfghanistanAfricaArgentinaAsiaAustraliaAustriaBahamasBangladeshBarbadosBelarusBoliviaBosnia and HerzegovinaBrazilBulgariaBurma / MyanmarCambodiaCameroonCanadaCaribbeanCentral AmericaChileChinaColombiaCongoCosta RicaCubaDenmarkDominican RepublicEastern AfricaEastern AsiaEastern EuropeEcuadorEgyptEl SalvadorEnglandEritreaEthiopiaEuropeFranceGermanyGhanaGreeceGuatemalaGuyanaHaitiHondurasHong KongHungaryIndiaIndonesiaIranIraqIrelandIsraelItalyJamaicaJapanJordanKenyaKoreaLaosLatin AmericaLatviaLebanonLiberiaMalaysiaMexicoMiddle AfricaMoldovaMoroccoNepalNetherlandsNicaraguaNigeriaNorth MacedoniaNorthern AfricaNorthern EuropeNorwayOceaniaPakistanPanamaPeruPhilippinesPolandPortugalRomaniaRussiaSaudi ArabiaScotlandSenegalSerbiaSierra LeoneSingaporeSouth AfricaSouth AmericaSouth Central AsiaSouth Eastern AsiaSouthern EuropeSpainSt. Vincent and the GrenadinesSudanSyriaTaiwanThailandTrinidad and TobagoTurkeyUgandaUkraineUzbekistanVenezuelaVietnamWest IndiesWestern AfricaWestern AsiaWestern EuropeYemenZaireZimbabwe
Income
Income (Families)
Income (Households)
Poverty
Poverty (Families)
Unemployment
Employment Occupations
Employment Industries
Employer Class
Commute Time
Commute Means
School Enrollment
Education by Degree Field
Occupancy
Finances
Physical Characteristics
Indianapolis
Compare Zip Codes
Comparison Subject

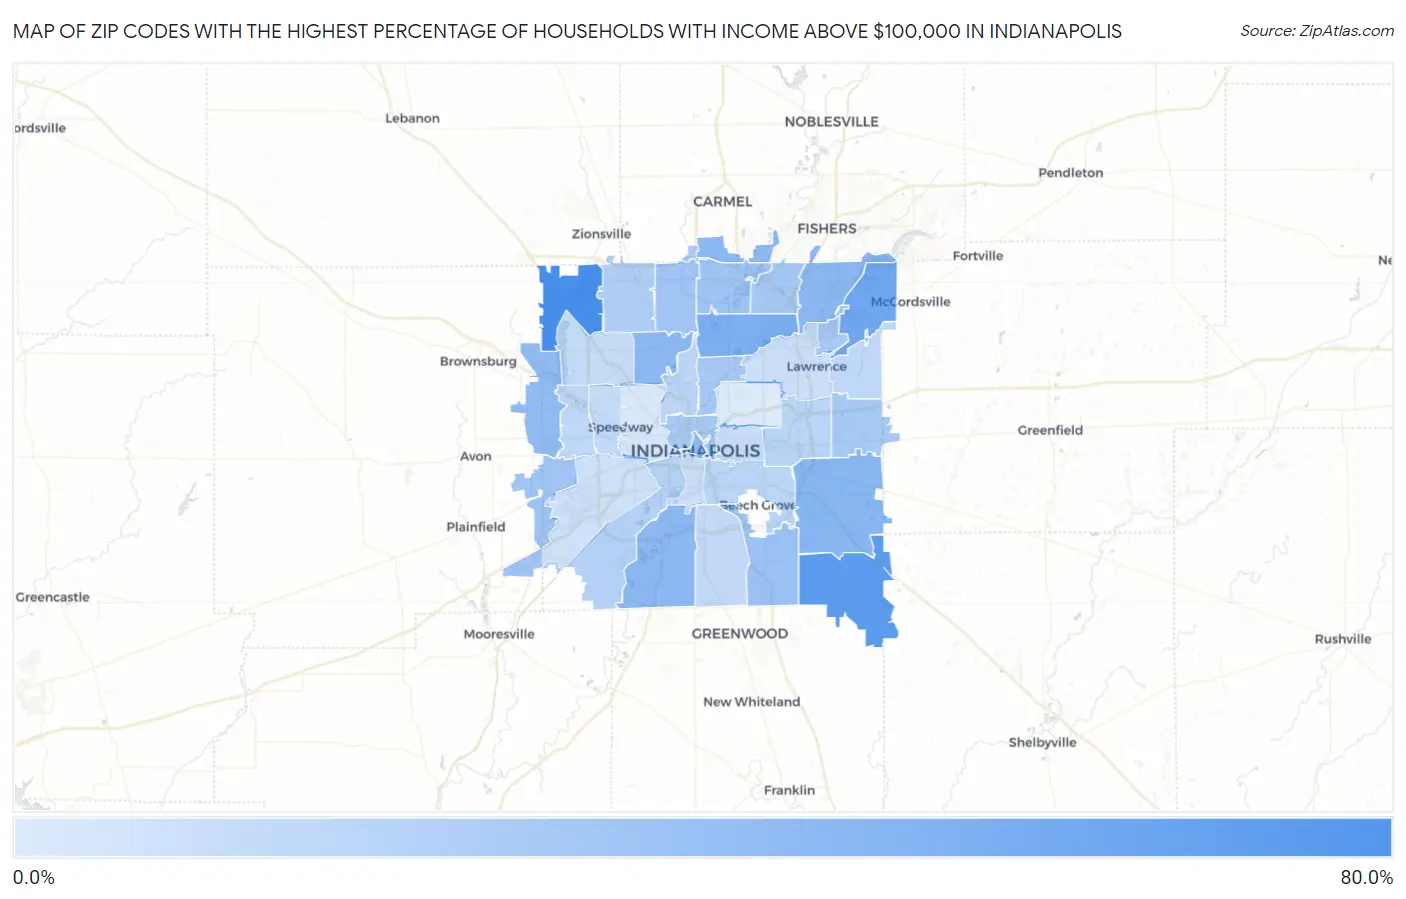
Map of Zip Codes with the Highest Percentage of Households with Income Above $100,000 in Indianapolis

0.0%
80.0%
Zip Codes with the Highest Percentage of Households with Income Above $100,000 in Indianapolis Map

Zip Codes with the Highest Percentage of Households with Income Above $100,000 in Indianapolis, IN

Zip Code Households with Income > $100k vs State vs National
1.4627876.2%30.7%(+45.5)#637.3%(+38.9)#511
2.4625964.5%30.7%(+33.8)#1237.3%(+27.2)#1,613
3.4623653.5%30.7%(+22.8)#3637.3%(+16.2)#3,832
4.4622048.1%30.7%(+17.4)#6637.3%(+10.8)#5,452
5.4623942.7%30.7%(+12.0)#10337.3%(+5.40)#7,569
6.4622841.0%30.7%(+10.3)#11937.3%(+3.70)#8,402
7.4621740.8%30.7%(+10.1)#12137.3%(+3.50)#8,505
8.4625640.8%30.7%(+10.1)#12237.3%(+3.50)#8,512
9.4628040.2%30.7%(+9.50)#12737.3%(+2.90)#8,800
10.4620438.6%30.7%(+7.90)#14237.3%(+1.30)#9,637
11.4623438.1%30.7%(+7.40)#15337.3%(+0.800)#9,923
12.4623733.9%30.7%(+3.20)#22637.3%(-3.40)#12,488
13.4624032.9%30.7%(+2.20)#24537.3%(-4.40)#13,192
14.4623131.8%30.7%(+1.10)#27237.3%(-5.50)#14,022
15.4626031.1%30.7%(+0.400)#29337.3%(-6.20)#14,555
16.4625029.8%30.7%(-0.900)#33037.3%(-7.50)#15,585
17.4620529.0%30.7%(-1.70)#35237.3%(-8.30)#16,228
18.4620228.9%30.7%(-1.80)#35837.3%(-8.40)#16,323
19.4622928.3%30.7%(-2.40)#37137.3%(-9.00)#16,853
20.4621627.1%30.7%(-3.60)#41037.3%(-10.2)#17,945
21.4629026.7%30.7%(-4.00)#41937.3%(-10.6)#18,316
22.4626825.4%30.7%(-5.30)#44037.3%(-11.9)#19,391
23.4622124.2%30.7%(-6.50)#48537.3%(-13.1)#20,482
24.4621921.3%30.7%(-9.40)#55337.3%(-16.0)#22,977
25.4620320.8%30.7%(-9.90)#56537.3%(-16.5)#23,399
26.4620820.1%30.7%(-10.6)#58137.3%(-17.2)#23,937
27.4621419.5%30.7%(-11.2)#59337.3%(-17.8)#24,435
28.4623519.3%30.7%(-11.4)#59537.3%(-18.0)#24,590
29.4622718.7%30.7%(-12.0)#60637.3%(-18.6)#25,034
30.4622417.3%30.7%(-13.4)#63437.3%(-20.0)#26,024
31.4625416.3%30.7%(-14.4)#64937.3%(-21.0)#26,701
32.4620116.0%30.7%(-14.7)#65337.3%(-21.3)#26,923
33.4622614.3%30.7%(-16.4)#67437.3%(-23.0)#27,924
34.4622514.2%30.7%(-16.5)#67837.3%(-23.1)#28,005
35.4624113.5%30.7%(-17.2)#68437.3%(-23.8)#28,343
36.4622210.1%30.7%(-20.6)#71537.3%(-27.2)#29,788
37.462188.1%30.7%(-22.6)#73037.3%(-29.2)#30,404

Common Questions

What are the Top 10 Zip Codes with the Highest Percentage of Households with Income Above $100,000 in Indianapolis, IN?
Top 10 Zip Codes with the Highest Percentage of Households with Income Above $100,000 in Indianapolis, IN are:
#1
76.2%
#2
64.5%
#3
53.5%
#4
48.1%
#5
42.7%
#6
41.0%
#7
40.8%
#8
40.8%
#9
40.2%
#10
38.6%
What zip code has the Highest Percentage of Households with Income Above $100,000 in Indianapolis, IN?
46278 has the Highest Percentage of Households with Income Above $100,000 in Indianapolis, IN with 76.2%.
What is the Percentage of Households with Income Above $100,000 in Indianapolis, IN?
Percentage of Households with Income Above $100,000 in Indianapolis is 26.3%.
What is the Percentage of Households with Income Above $100,000 in Indiana?
Percentage of Households with Income Above $100,000 in Indiana is 30.7%.
What is the Percentage of Households with Income Above $100,000 in the United States?
Percentage of Households with Income Above $100,000 in the United States is 37.3%.