Zip Codes with the Highest Percentage of Population with a Degree in Bio, Nature & Agricultural in Indianapolis, IN
RELATED REPORTS & OPTIONS
Bio, Nature & Agricultural
Indianapolis
Compare Zip Codes
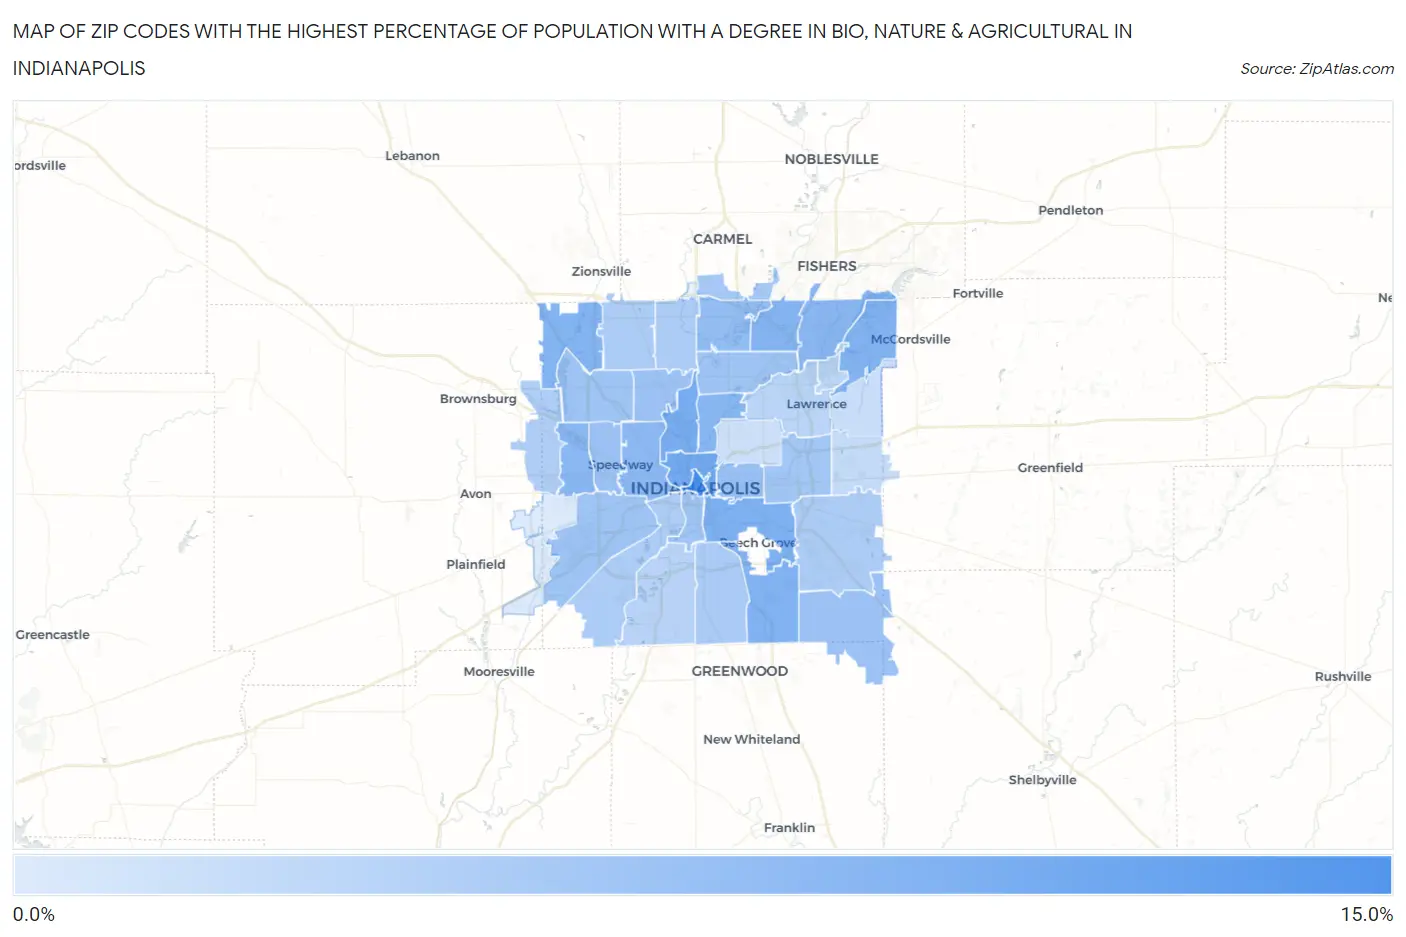
Map of Zip Codes with the Highest Percentage of Population with a Degree in Bio, Nature & Agricultural in Indianapolis
0.79%
13.7%
Zip Codes with the Highest Percentage of Population with a Degree in Bio, Nature & Agricultural in Indianapolis, IN
| Zip Code | % Graduates | vs State | vs National | |
| 1. | 46204 | 13.7% | 6.1%(+7.62)#92 | 6.4%(+7.35)#4,947 |
| 2. | 46202 | 9.9% | 6.1%(+3.77)#149 | 6.4%(+3.50)#8,305 |
| 3. | 46208 | 9.4% | 6.1%(+3.29)#161 | 6.4%(+3.02)#8,964 |
| 4. | 46203 | 8.8% | 6.1%(+2.75)#182 | 6.4%(+2.48)#9,800 |
| 5. | 46237 | 8.5% | 6.1%(+2.39)#190 | 6.4%(+2.12)#10,370 |
| 6. | 46236 | 8.4% | 6.1%(+2.35)#191 | 6.4%(+2.08)#10,433 |
| 7. | 46278 | 8.4% | 6.1%(+2.29)#194 | 6.4%(+2.02)#10,530 |
| 8. | 46250 | 8.1% | 6.1%(+2.04)#203 | 6.4%(+1.77)#10,962 |
| 9. | 46205 | 7.9% | 6.1%(+1.79)#211 | 6.4%(+1.52)#11,431 |
| 10. | 46256 | 7.8% | 6.1%(+1.70)#217 | 6.4%(+1.43)#11,604 |
| 11. | 46214 | 7.7% | 6.1%(+1.60)#219 | 6.4%(+1.33)#11,833 |
| 12. | 46222 | 7.6% | 6.1%(+1.49)#222 | 6.4%(+1.22)#12,042 |
| 13. | 46240 | 6.9% | 6.1%(+0.770)#251 | 6.4%(+0.501)#13,690 |
| 14. | 46201 | 6.6% | 6.1%(+0.512)#261 | 6.4%(+0.242)#14,377 |
| 15. | 46224 | 6.4% | 6.1%(+0.328)#270 | 6.4%(+0.058)#14,834 |
| 16. | 46259 | 6.2% | 6.1%(+0.112)#276 | 6.4%(-0.157)#15,381 |
| 17. | 46228 | 6.2% | 6.1%(+0.090)#277 | 6.4%(-0.179)#15,434 |
| 18. | 46254 | 6.1% | 6.1%(-0.025)#284 | 6.4%(-0.294)#15,753 |
| 19. | 46241 | 5.9% | 6.1%(-0.155)#296 | 6.4%(-0.425)#16,123 |
| 20. | 46220 | 5.9% | 6.1%(-0.178)#298 | 6.4%(-0.447)#16,192 |
| 21. | 46225 | 5.7% | 6.1%(-0.393)#314 | 6.4%(-0.662)#16,766 |
| 22. | 46219 | 5.5% | 6.1%(-0.605)#325 | 6.4%(-0.874)#17,374 |
| 23. | 46280 | 5.4% | 6.1%(-0.732)#329 | 6.4%(-1.00)#17,756 |
| 24. | 46227 | 5.0% | 6.1%(-1.12)#361 | 6.4%(-1.39)#18,903 |
| 25. | 46268 | 4.9% | 6.1%(-1.21)#368 | 6.4%(-1.48)#19,178 |
| 26. | 46239 | 4.9% | 6.1%(-1.23)#370 | 6.4%(-1.50)#19,257 |
| 27. | 46221 | 4.8% | 6.1%(-1.25)#371 | 6.4%(-1.52)#19,326 |
| 28. | 46260 | 4.7% | 6.1%(-1.34)#378 | 6.4%(-1.61)#19,596 |
| 29. | 46234 | 4.7% | 6.1%(-1.42)#385 | 6.4%(-1.69)#19,812 |
| 30. | 46217 | 3.7% | 6.1%(-2.34)#450 | 6.4%(-2.61)#22,282 |
| 31. | 46226 | 3.5% | 6.1%(-2.54)#469 | 6.4%(-2.81)#22,726 |
| 32. | 46216 | 3.3% | 6.1%(-2.74)#484 | 6.4%(-3.01)#23,150 |
| 33. | 46229 | 2.8% | 6.1%(-3.31)#517 | 6.4%(-3.58)#24,281 |
| 34. | 46235 | 2.5% | 6.1%(-3.55)#530 | 6.4%(-3.82)#24,661 |
| 35. | 46218 | 2.2% | 6.1%(-3.93)#547 | 6.4%(-4.20)#25,179 |
| 36. | 46231 | 0.79% | 6.1%(-5.30)#595 | 6.4%(-5.57)#26,331 |
1
Common Questions
What are the Top 10 Zip Codes with the Highest Percentage of Population with a Degree in Bio, Nature & Agricultural in Indianapolis, IN?
Top 10 Zip Codes with the Highest Percentage of Population with a Degree in Bio, Nature & Agricultural in Indianapolis, IN are:
What zip code has the Highest Percentage of Population with a Degree in Bio, Nature & Agricultural in Indianapolis, IN?
46204 has the Highest Percentage of Population with a Degree in Bio, Nature & Agricultural in Indianapolis, IN with 13.7%.
What is the Percentage of Population with a Degree in Bio, Nature & Agricultural in Indianapolis, IN?
Percentage of Population with a Degree in Bio, Nature & Agricultural in Indianapolis is 6.5%.
What is the Percentage of Population with a Degree in Bio, Nature & Agricultural in Indiana?
Percentage of Population with a Degree in Bio, Nature & Agricultural in Indiana is 6.1%.
What is the Percentage of Population with a Degree in Bio, Nature & Agricultural in the United States?
Percentage of Population with a Degree in Bio, Nature & Agricultural in the United States is 6.4%.