Costa Rican vs Scandinavian GED/Equivalency
COMPARE
Costa Rican
Scandinavian
GED/Equivalency
GED/Equivalency Comparison
Costa Ricans
Scandinavians
85.2%
GED/EQUIVALENCY
20.4/ 100
METRIC RATING
197th/ 347
METRIC RANK
87.9%
GED/EQUIVALENCY
99.3/ 100
METRIC RATING
60th/ 347
METRIC RANK
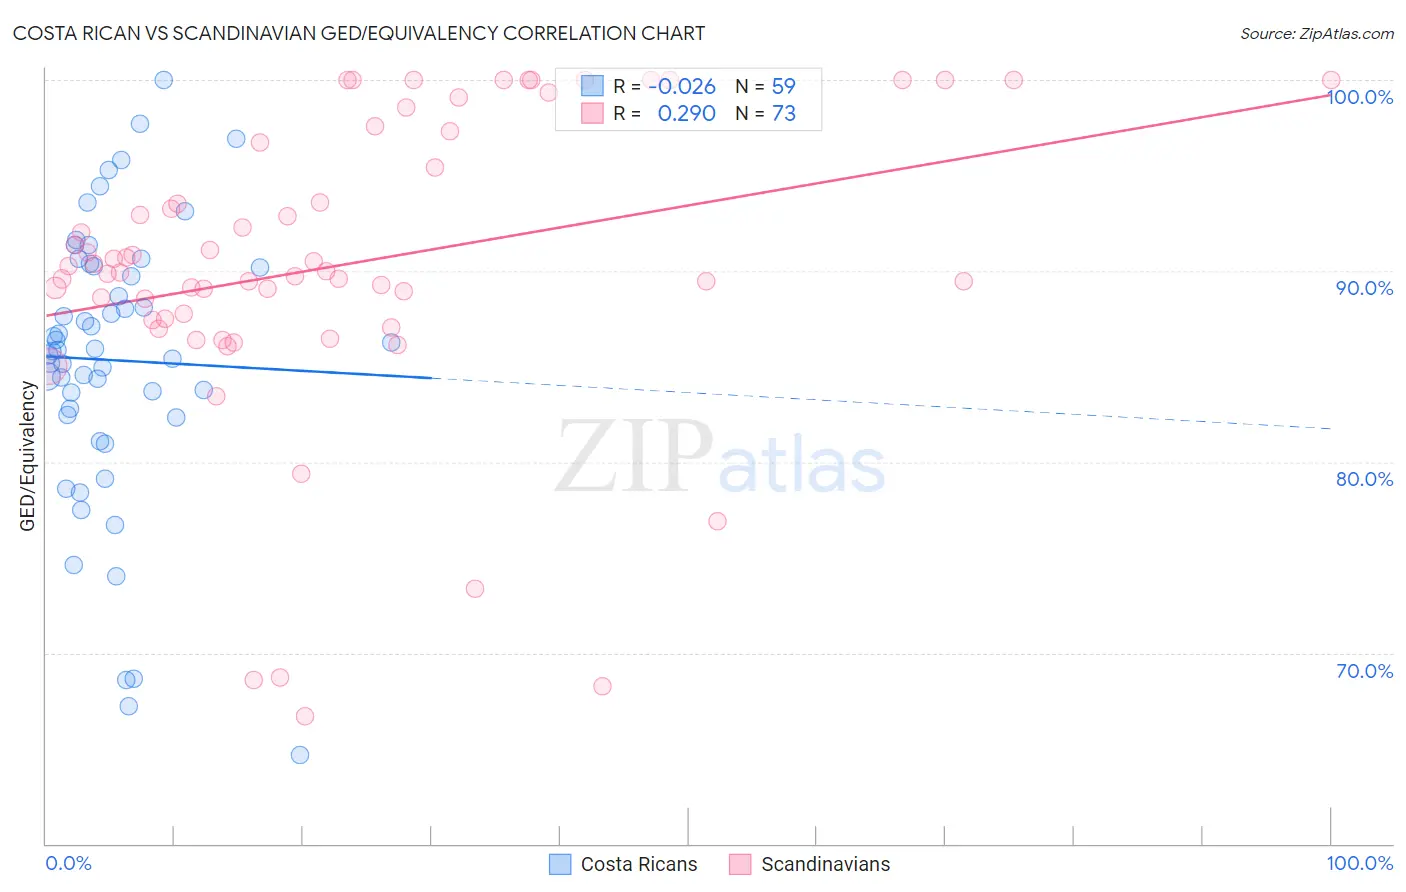
Costa Rican vs Scandinavian GED/Equivalency Correlation Chart
The statistical analysis conducted on geographies consisting of 253,601,897 people shows no correlation between the proportion of Costa Ricans and percentage of population with at least ged/equivalency education in the United States with a correlation coefficient (R) of -0.026 and weighted average of 85.2%. Similarly, the statistical analysis conducted on geographies consisting of 472,660,435 people shows a weak positive correlation between the proportion of Scandinavians and percentage of population with at least ged/equivalency education in the United States with a correlation coefficient (R) of 0.290 and weighted average of 87.9%, a difference of 3.3%.
GED/Equivalency Correlation Summary
| Measurement | Costa Rican | Scandinavian |
| Minimum | 64.7% | 66.7% |
| Maximum | 100.0% | 100.0% |
| Range | 35.3% | 33.3% |
| Mean | 85.3% | 90.3% |
| Median | 85.9% | 90.0% |
| Interquartile 25% (IQ1) | 82.5% | 87.5% |
| Interquartile 75% (IQ3) | 90.3% | 97.0% |
| Interquartile Range (IQR) | 7.8% | 9.6% |
| Standard Deviation (Sample) | 7.3% | 7.9% |
| Standard Deviation (Population) | 7.3% | 7.8% |
Similar Demographics by GED/Equivalency
Demographics Similar to Costa Ricans by GED/Equivalency
In terms of ged/equivalency, the demographic groups most similar to Costa Ricans are Puget Sound Salish (85.2%, a difference of 0.010%), Chippewa (85.2%, a difference of 0.010%), Tongan (85.2%, a difference of 0.010%), Delaware (85.2%, a difference of 0.060%), and South American Indian (85.2%, a difference of 0.070%).
| Demographics | Rating | Rank | GED/Equivalency |
| Alaskan Athabascans | 27.5 /100 | #190 | Fair 85.3% |
| South American Indians | 22.8 /100 | #191 | Fair 85.2% |
| Immigrants | Nonimmigrants | 22.7 /100 | #192 | Fair 85.2% |
| Delaware | 22.2 /100 | #193 | Fair 85.2% |
| Puget Sound Salish | 20.8 /100 | #194 | Fair 85.2% |
| Chippewa | 20.8 /100 | #195 | Fair 85.2% |
| Tongans | 20.7 /100 | #196 | Fair 85.2% |
| Costa Ricans | 20.4 /100 | #197 | Fair 85.2% |
| Immigrants | Africa | 17.5 /100 | #198 | Poor 85.1% |
| Somalis | 16.4 /100 | #199 | Poor 85.0% |
| Uruguayans | 16.0 /100 | #200 | Poor 85.0% |
| Portuguese | 15.9 /100 | #201 | Poor 85.0% |
| Cree | 15.9 /100 | #202 | Poor 85.0% |
| Panamanians | 15.3 /100 | #203 | Poor 85.0% |
| Hawaiians | 15.2 /100 | #204 | Poor 85.0% |
Demographics Similar to Scandinavians by GED/Equivalency
In terms of ged/equivalency, the demographic groups most similar to Scandinavians are European (87.9%, a difference of 0.0%), Serbian (87.9%, a difference of 0.010%), Immigrants from Czechoslovakia (87.9%, a difference of 0.020%), Northern European (87.9%, a difference of 0.020%), and German (87.9%, a difference of 0.020%).
| Demographics | Rating | Rank | GED/Equivalency |
| Immigrants | South Africa | 99.4 /100 | #53 | Exceptional 88.0% |
| Soviet Union | 99.4 /100 | #54 | Exceptional 88.0% |
| New Zealanders | 99.4 /100 | #55 | Exceptional 88.0% |
| Immigrants | Denmark | 99.4 /100 | #56 | Exceptional 88.0% |
| Immigrants | Czechoslovakia | 99.3 /100 | #57 | Exceptional 87.9% |
| Northern Europeans | 99.3 /100 | #58 | Exceptional 87.9% |
| Serbians | 99.3 /100 | #59 | Exceptional 87.9% |
| Scandinavians | 99.3 /100 | #60 | Exceptional 87.9% |
| Europeans | 99.3 /100 | #61 | Exceptional 87.9% |
| Germans | 99.3 /100 | #62 | Exceptional 87.9% |
| Immigrants | Turkey | 99.2 /100 | #63 | Exceptional 87.9% |
| Immigrants | Canada | 99.2 /100 | #64 | Exceptional 87.9% |
| Immigrants | North America | 99.1 /100 | #65 | Exceptional 87.8% |
| Immigrants | Bulgaria | 99.1 /100 | #66 | Exceptional 87.8% |
| British | 99.1 /100 | #67 | Exceptional 87.8% |