Costa Rican vs Immigrants from Eastern Africa GED/Equivalency
COMPARE
Costa Rican
Immigrants from Eastern Africa
GED/Equivalency
GED/Equivalency Comparison
Costa Ricans
Immigrants from Eastern Africa
85.2%
GED/EQUIVALENCY
20.4/ 100
METRIC RATING
197th/ 347
METRIC RANK
85.7%
GED/EQUIVALENCY
47.7/ 100
METRIC RATING
176th/ 347
METRIC RANK
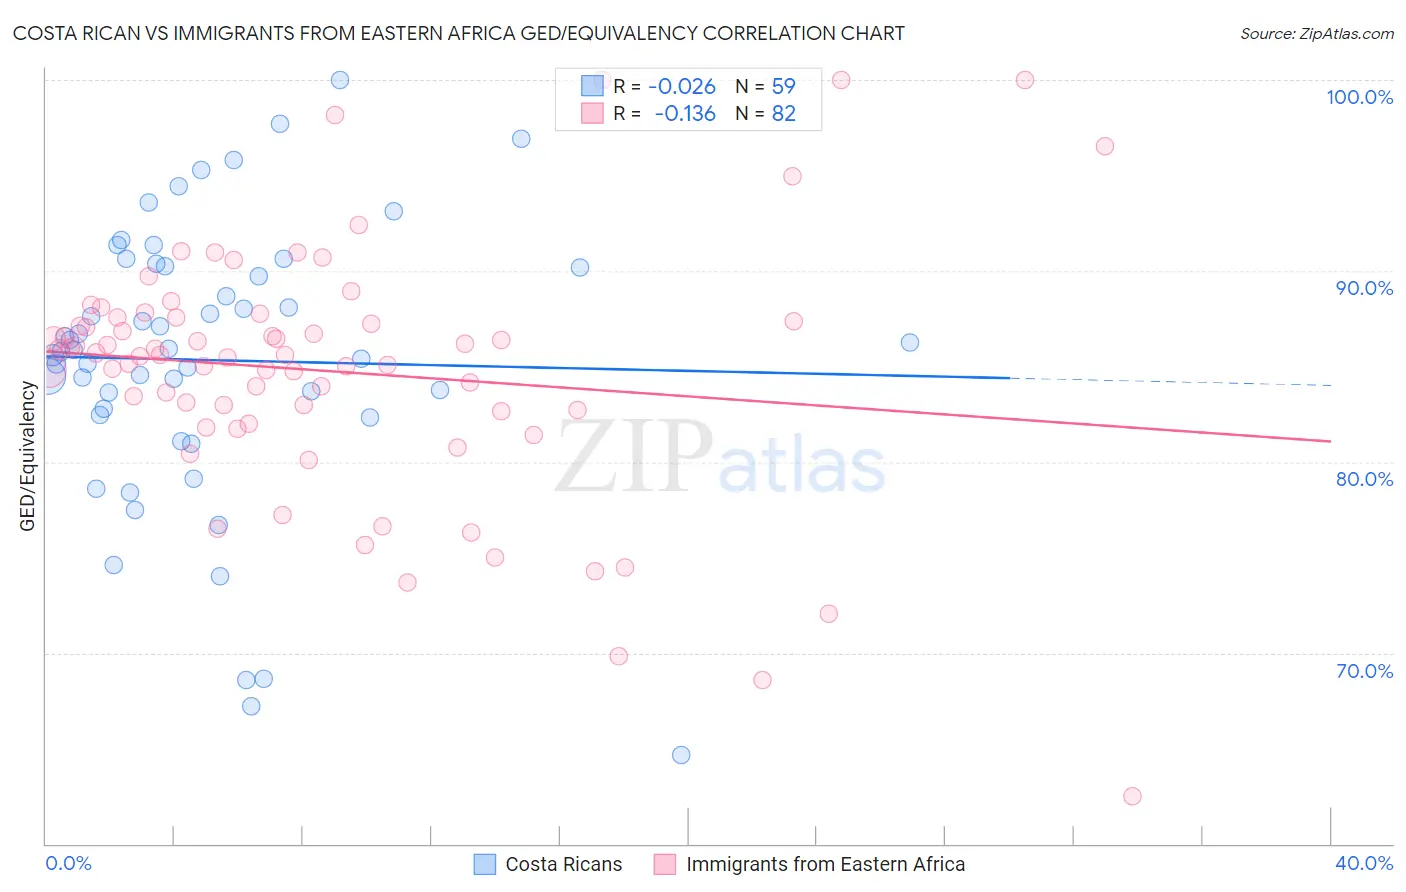
Costa Rican vs Immigrants from Eastern Africa GED/Equivalency Correlation Chart
The statistical analysis conducted on geographies consisting of 253,601,897 people shows no correlation between the proportion of Costa Ricans and percentage of population with at least ged/equivalency education in the United States with a correlation coefficient (R) of -0.026 and weighted average of 85.2%. Similarly, the statistical analysis conducted on geographies consisting of 355,153,076 people shows a poor negative correlation between the proportion of Immigrants from Eastern Africa and percentage of population with at least ged/equivalency education in the United States with a correlation coefficient (R) of -0.136 and weighted average of 85.7%, a difference of 0.66%.
GED/Equivalency Correlation Summary
| Measurement | Costa Rican | Immigrants from Eastern Africa |
| Minimum | 64.7% | 62.5% |
| Maximum | 100.0% | 100.0% |
| Range | 35.3% | 37.5% |
| Mean | 85.3% | 84.7% |
| Median | 85.9% | 85.6% |
| Interquartile 25% (IQ1) | 82.5% | 82.7% |
| Interquartile 75% (IQ3) | 90.3% | 87.5% |
| Interquartile Range (IQR) | 7.8% | 4.9% |
| Standard Deviation (Sample) | 7.3% | 6.6% |
| Standard Deviation (Population) | 7.3% | 6.6% |
Similar Demographics by GED/Equivalency
Demographics Similar to Costa Ricans by GED/Equivalency
In terms of ged/equivalency, the demographic groups most similar to Costa Ricans are Puget Sound Salish (85.2%, a difference of 0.010%), Chippewa (85.2%, a difference of 0.010%), Tongan (85.2%, a difference of 0.010%), Delaware (85.2%, a difference of 0.060%), and South American Indian (85.2%, a difference of 0.070%).
| Demographics | Rating | Rank | GED/Equivalency |
| Alaskan Athabascans | 27.5 /100 | #190 | Fair 85.3% |
| South American Indians | 22.8 /100 | #191 | Fair 85.2% |
| Immigrants | Nonimmigrants | 22.7 /100 | #192 | Fair 85.2% |
| Delaware | 22.2 /100 | #193 | Fair 85.2% |
| Puget Sound Salish | 20.8 /100 | #194 | Fair 85.2% |
| Chippewa | 20.8 /100 | #195 | Fair 85.2% |
| Tongans | 20.7 /100 | #196 | Fair 85.2% |
| Costa Ricans | 20.4 /100 | #197 | Fair 85.2% |
| Immigrants | Africa | 17.5 /100 | #198 | Poor 85.1% |
| Somalis | 16.4 /100 | #199 | Poor 85.0% |
| Uruguayans | 16.0 /100 | #200 | Poor 85.0% |
| Portuguese | 15.9 /100 | #201 | Poor 85.0% |
| Cree | 15.9 /100 | #202 | Poor 85.0% |
| Panamanians | 15.3 /100 | #203 | Poor 85.0% |
| Hawaiians | 15.2 /100 | #204 | Poor 85.0% |
Demographics Similar to Immigrants from Eastern Africa by GED/Equivalency
In terms of ged/equivalency, the demographic groups most similar to Immigrants from Eastern Africa are Immigrants from Bolivia (85.8%, a difference of 0.040%), Ottawa (85.8%, a difference of 0.050%), Immigrants from Uganda (85.7%, a difference of 0.050%), Immigrants from Venezuela (85.8%, a difference of 0.060%), and Korean (85.6%, a difference of 0.13%).
| Demographics | Rating | Rank | GED/Equivalency |
| Immigrants | Ethiopia | 61.2 /100 | #169 | Good 86.0% |
| Afghans | 59.7 /100 | #170 | Average 85.9% |
| Immigrants | Chile | 57.3 /100 | #171 | Average 85.9% |
| Bermudans | 55.1 /100 | #172 | Average 85.8% |
| Immigrants | Venezuela | 50.7 /100 | #173 | Average 85.8% |
| Ottawa | 50.0 /100 | #174 | Average 85.8% |
| Immigrants | Bolivia | 49.8 /100 | #175 | Average 85.8% |
| Immigrants | Eastern Africa | 47.7 /100 | #176 | Average 85.7% |
| Immigrants | Uganda | 45.2 /100 | #177 | Average 85.7% |
| Koreans | 41.2 /100 | #178 | Average 85.6% |
| Aleuts | 40.5 /100 | #179 | Average 85.6% |
| Immigrants | Southern Europe | 38.4 /100 | #180 | Fair 85.5% |
| Moroccans | 37.7 /100 | #181 | Fair 85.5% |
| Sudanese | 35.2 /100 | #182 | Fair 85.5% |
| Immigrants | Sudan | 34.2 /100 | #183 | Fair 85.5% |